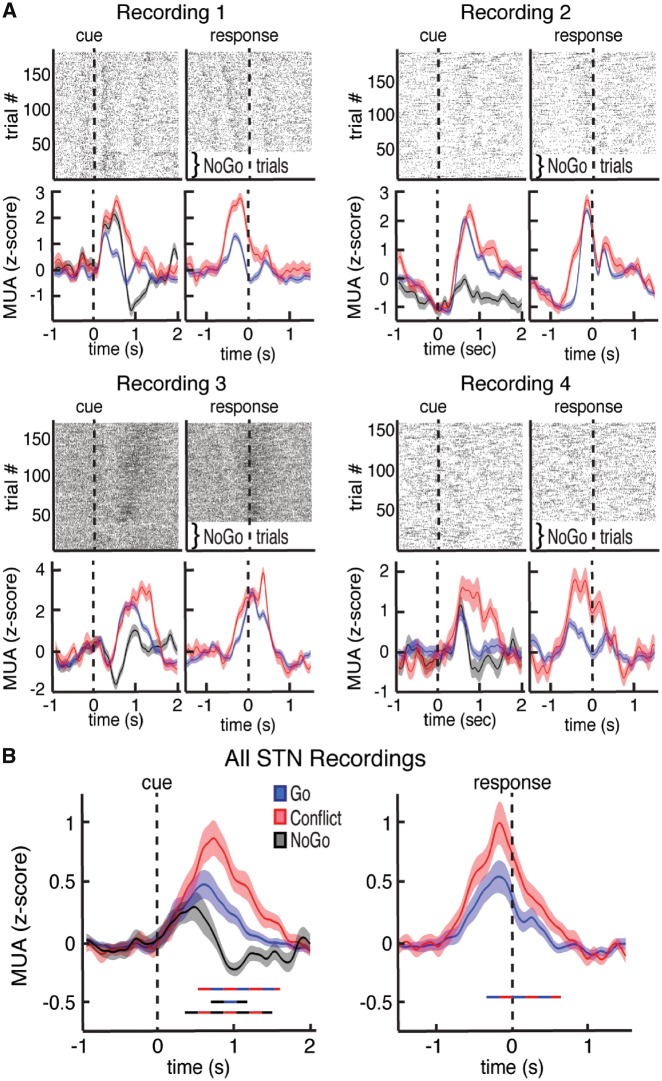
Figure 2.
Task-related changes in multi-unit activity in the STN. (A) Top: Raster plot for four neuronal clusters exhibiting changes in voltage thresholded spiking activity during the task. Bottom: Multi-unit activity (MUA) was extracted from each recording and plotted separately for Go, Conflict, and NoGo trials. Data are aligned to arrow onset (left) and to the motor response (right, t = 0) for four separate recordings. (B) Average continuous-time multi-unit activity for all STN microelectrode recordings that showed spiking activity. Time points exhibiting a significant difference between trial types (P < 0.05, corrected for multiple comparisons, permutation test) are denoted by coloured horizontal bars denoting which comparison was made. Conflict trials showed significantly higher multi-unit activity than Go trials. Notably, the trials in which participants inhibited all movements (NoGo trials) showed the lowest average multi-unit activity levels.

