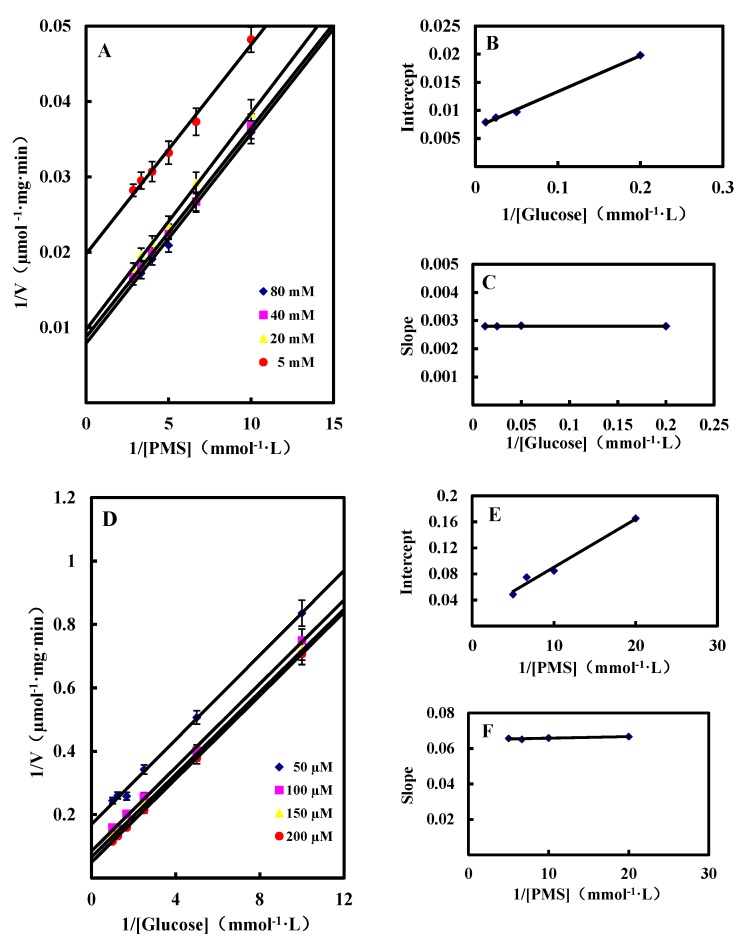
Figure 4.
Initial velocity patterns for GlcDH reaction from A. globiformis C224. (A) PMS was varied at the following fixed concentrations of d-glucose: 5, 20, 40 and 80 mM; (D) d-Glucose was varied at the following fixed concentrations PMS: 50, 100, 150 and 200 µM. Inset (B), (C), (E) and (F), slope and 1/v axis intercept versus 1/[Glucose] or 1/[PMS].

