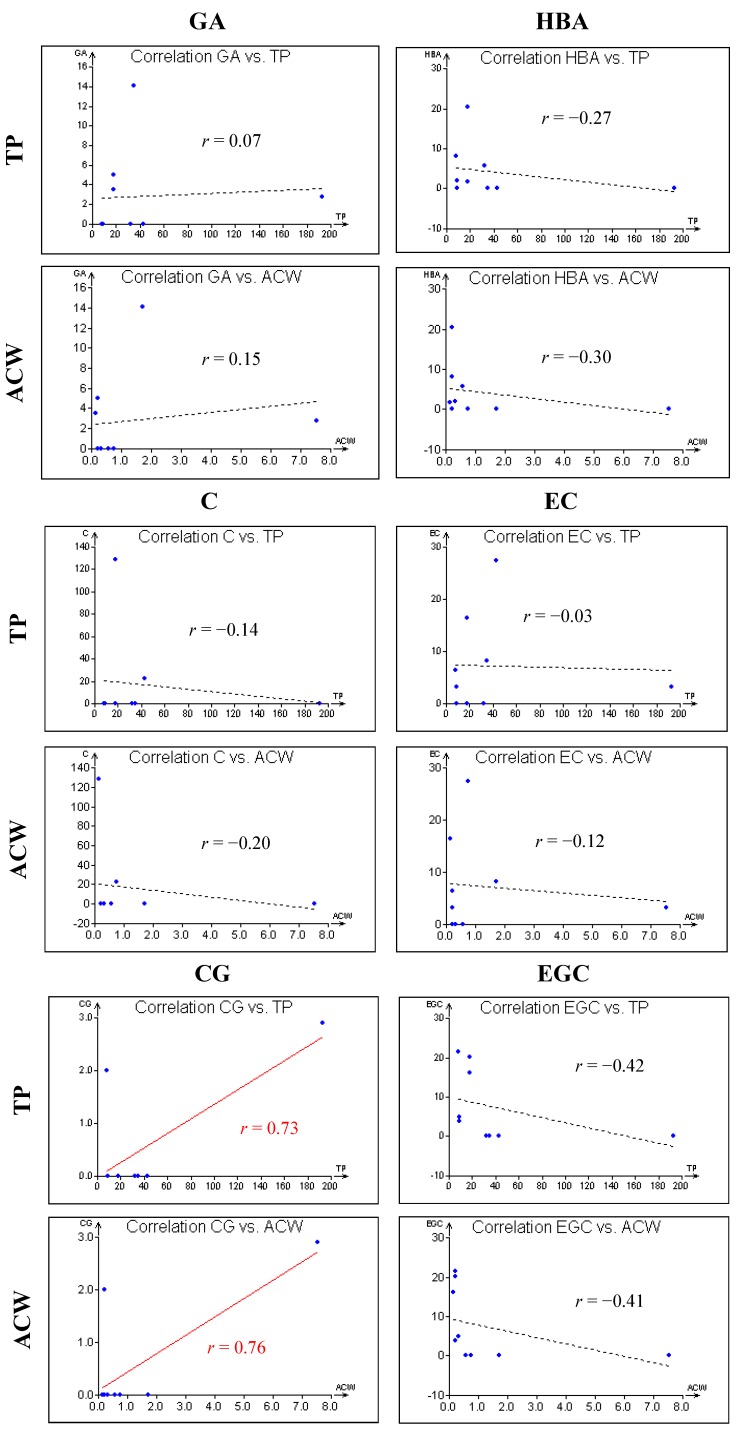
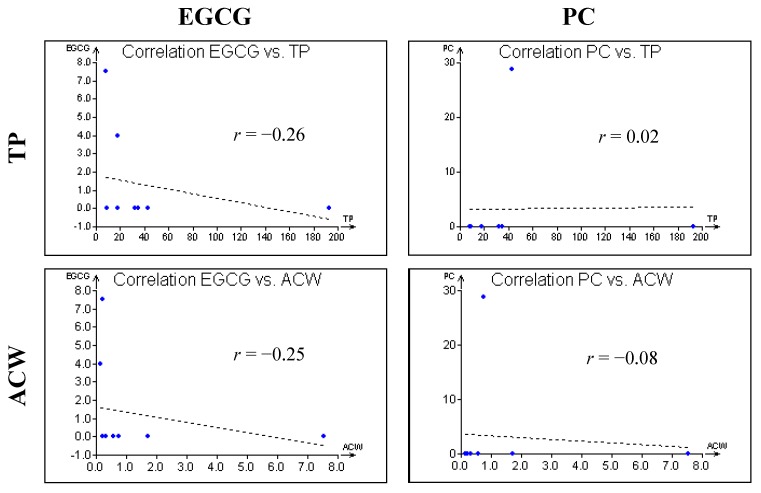
Figure 3.
Graphic illustration of correlations between antioxidant capacities of either total phenolic contents (TP), or water soluble compounds (ACW) and amounts of selected phenolic compounds (GA—gallic acid; HBA—4-hydroxybenzoic acid; C—catechin hydrate; EC—epicatechin; CG—catechin gallate; EGC—epigallocatechin; EGCG—epigallocatechin gallate; PC—pyrocatechol) in algal food products together with values of their Pearson correlation coefficients (r). The level of probability was set to p < 0.05.


