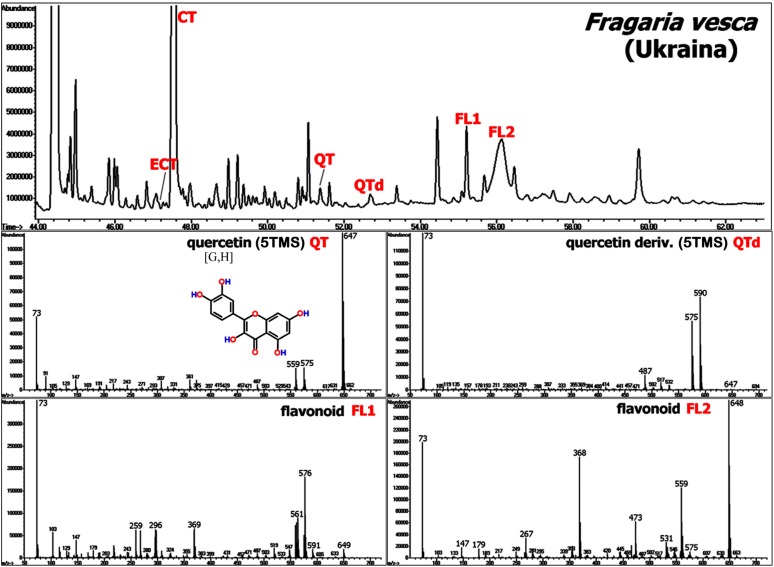
Figure 9.
The upper figure shows a chromatogram (TIC), cut from the analysis of a strawberry leaf sample (Fragaria vesca L., genotype “Ukraina”). Several MS spectra of TMS derivatives of flavonoids such as quercetin (5TMS) (QT), quercetin derivative (5TMS) (QTd), and other flavonoid structures (FL1 and FL2) are depicted below. CT = catechin (5TMS) and ECT = epicatechin (5TMS). MS spectra of CT, ECT and QT can be found in the Golm Metabolome Database [G], Human Metabolome Database [H], MassBank [M], and/or NIST Chemistry WebBook [N] (see also Figure 8).

