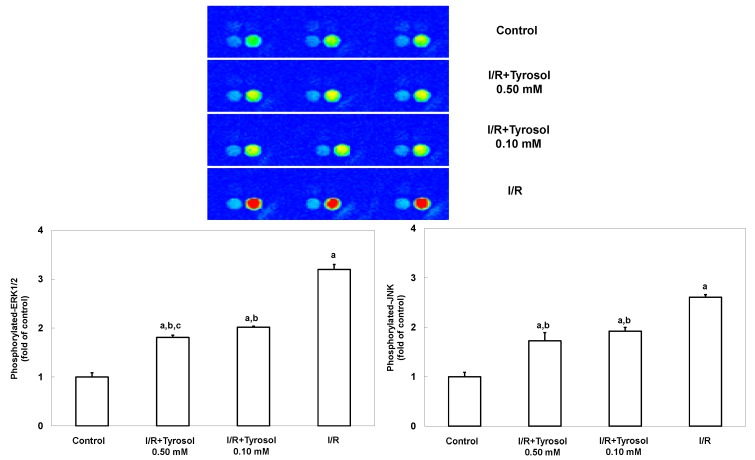
Figure 6.
Effect of tyrosol on ERK and JNK activation in H9c2 cardiomyocytes during I/R. Cells were incubated with tyrosol (0.10 and 0.50 mM) before and during I/R. Phosphorylated-ERK and phosphorylated-JNK levels were determined using a MAP kinase phosphoprotein electrochemiluminescent sandwich ELISA assay. Sectoral images exhibiting chemiluminescence are shown, reflecting the levels of p-ERK and p-JNK in the samples. Left and right bright spots represent p-JNK and p-ERK, respectively. Results are expressed as fold that of control group and means ± SEs of the data of three independent experiments are shown. a: p < 0.05 compared with control, b: p < 0.05 compared with I/R cells, c: p < 0.05 compared with I/R + Tyrosol 0.10 mM cells.

