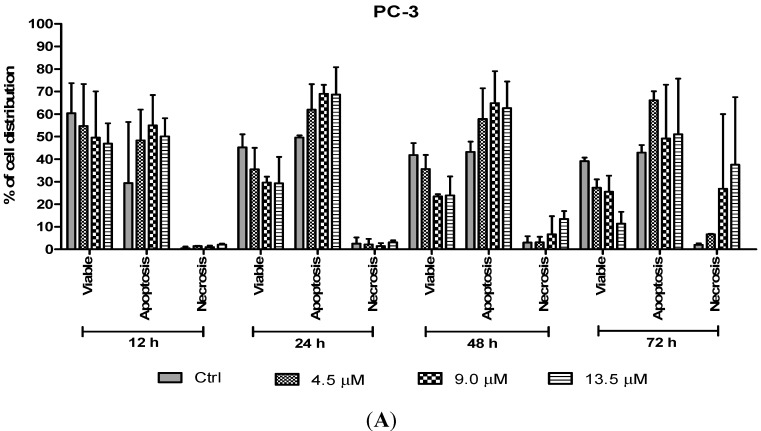
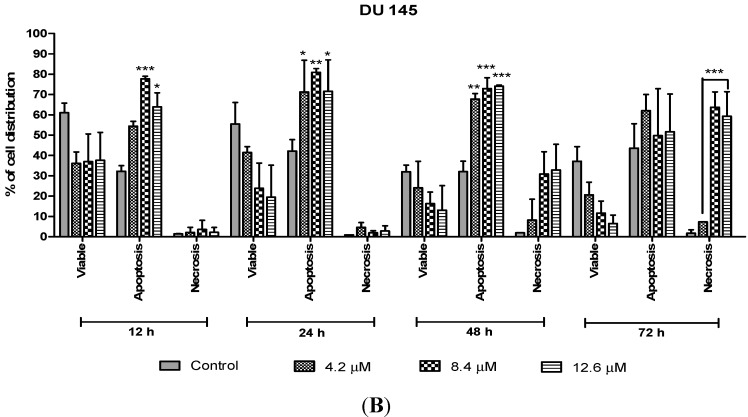
Figure 8.
Percentage of cell population in (A) PC-3 cells and (B) DU 145 cells treated with MS17 for 12, 24, 48 and 72 h. Treated and non-treated cells were double stained with AO/EB and a minimum of 200 cells were counted per sample and the percentage of cells from each population (viable, apoptosis and necrosis) was calculated. Samples were run in triplicates and comparable results were obtained from three independent experiments. Comparison between data sets was performed using ANOVA. * p < 0.05, ** p < 0.01 and *** p < 0.001 indicates statistically significant differences between the means of values obtained with treated vs. control.


