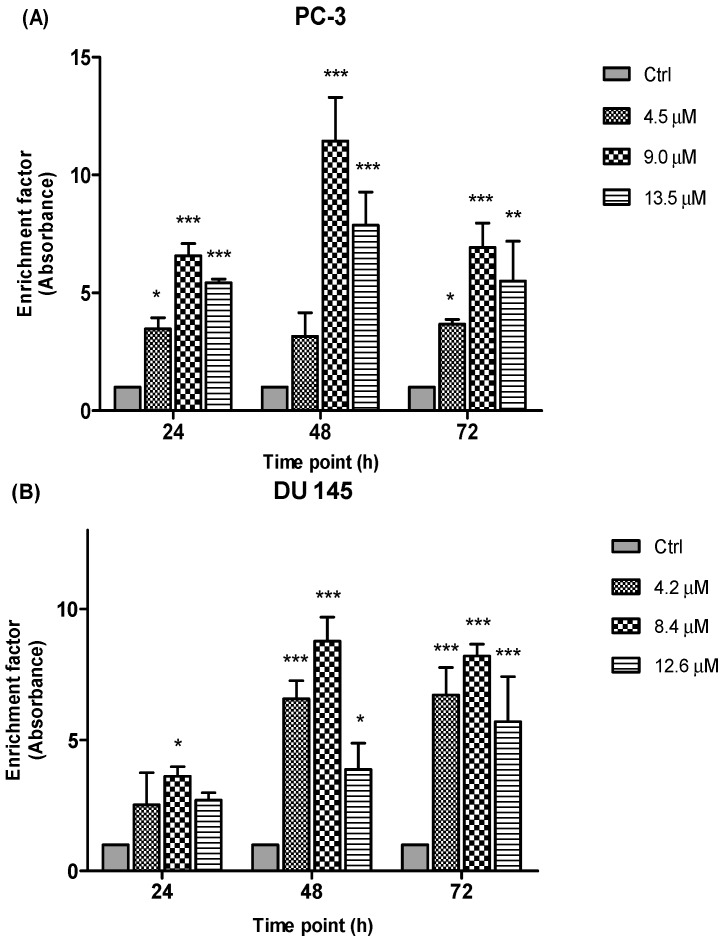
Figure 10.
Enrichment of nucleosomes in MS17-treated (A) PC-3 and (B) DU 145 cells at 24, 48 and 72 h incubation. Results are expressed as mean ratio ± S.E. of the absorbance from cells treated with MS17 relative to absorbance of untreated cells and comparison between data sets was performed using ANOVA. * p < 0.05, ** p < 0.01 and *** p < 0.001 indicates statistically significant differences between the means of values obtained with treated vs. control. Samples were run in duplicates and comparable results obtained from two independent experiments.

