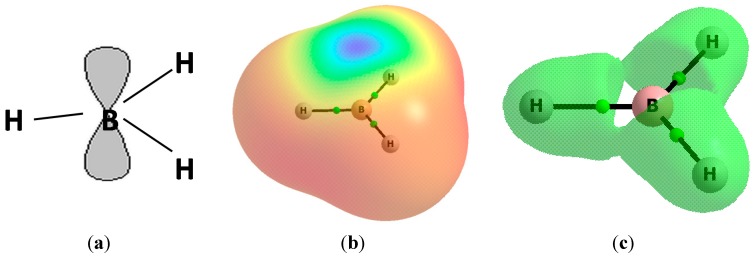
Figure 1.
The BH3 molecule, (a) scheme showing the vacant p-orbital; (b) the electrostatic potential surface calculated for the 0.001 au electron density, red and blue colors correspond to negative and positive EP, respectively; (c) the molecular graph of the BH3 molecule with the reactive surface. Big circles correspond to atomic attractors and small green circles to the bond critical point; results of the MP2/aug-cc-pVTZ calculations.

