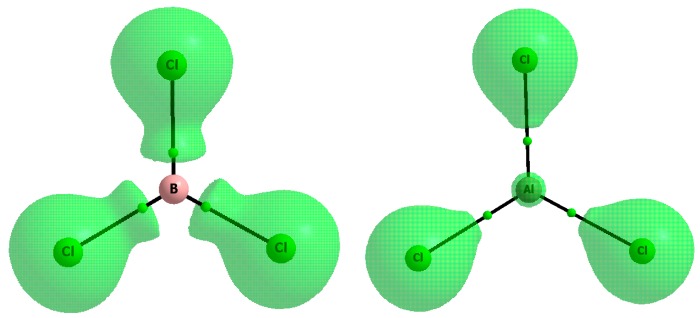
Figure 6.
The molecular graphs of the BCl3 (left) and AlCl3 (right) molecules; solid lines correspond to bond paths, big circles to attractors and small green circles to BCPs, the reactive surfaces (∇2ρ(r) = 0 isosurfaces) for these molecules are presented; results of the MP2/aug-cc-pVTZ calculations.

