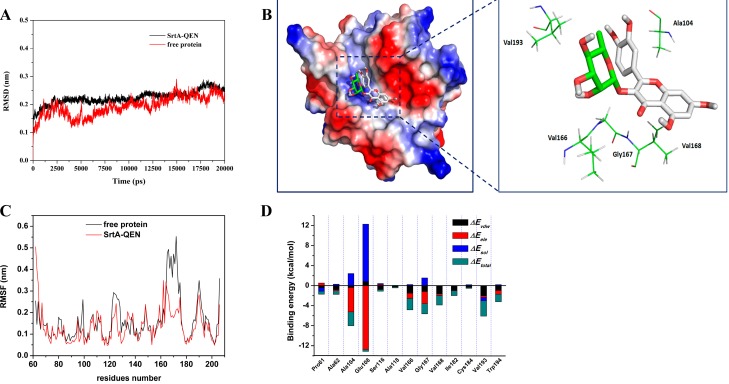
Figure 3.
Structures of the screening compounds. (A) The root-mean-square deviations (RMSD) of all the atoms of SrtA-QEN complexes with respect to their initial structures as a function of time. (B) The predicted binding mode of QEN in the SrtA binding pocket obtained from the MD simulation. (C) RMSFs of residues of the whole protein in the SrtA-QEN complex and free SrtA during the last 10-ns simulation. (D) Decomposition of the binding energy on a per-residue basis in the SrtA-QEN complex.

