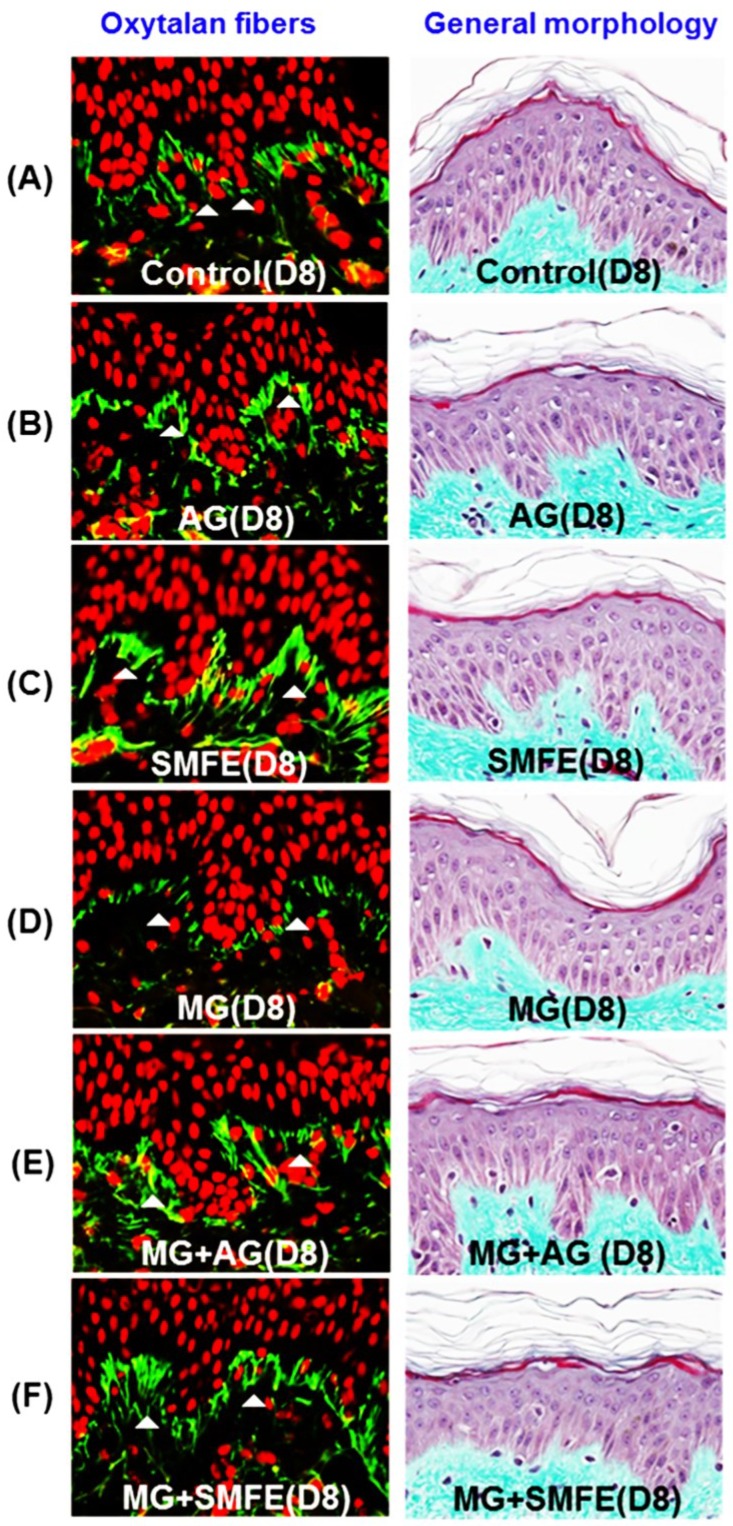
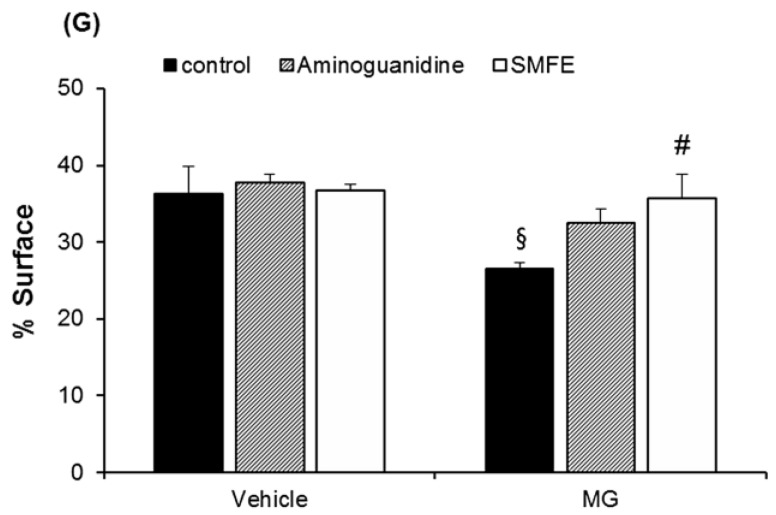
Figure 2.
Immunostaining of fibrillin-1 in untreated batch (A), treated with AG (B), treated with SMFE (C), treated with MG (D), treated with MG + AG (E) and treated with MG + SMFE (F). (G) Image analysis of the surface percentage occupied by fibrillin-1 under the dermal-epidermal junction, as a function of the product applied. The average fluorescence intensity values were calculated using Image J software. Data are mean ± standard deviation. § p < 0.01 compared with the vehicle-treated group, # p < 0.05 compared with the MG treated group (n = 3).


