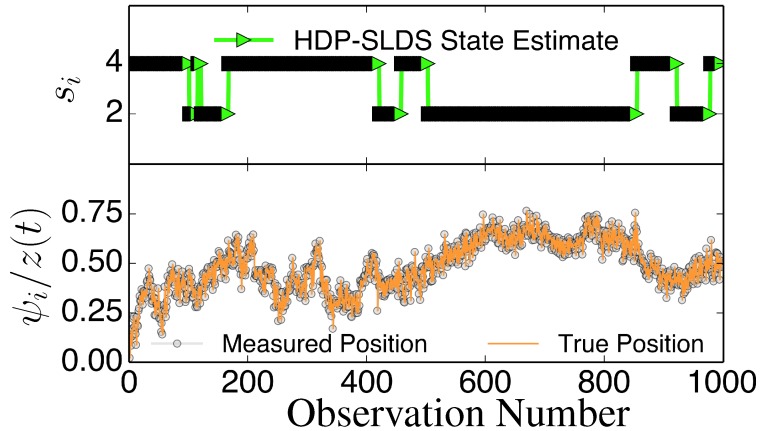
Figure 1.
Illustration of abrupt changes in . The bottom panel displays the z component of the unobservable state (orange solid line) and the noisily measured values ψz (grey circles). The top panel illustrates the inferred states si. In this trajectory, there are only two underlying states that differ in their value; an abrupt change in induced by a state change causes z to slowly drift towards a fixed point dictated by the (unobserved) associated with the state (the magnitude of the drift or “mean reversion rate” depends on the distance of z for the fixed point).

