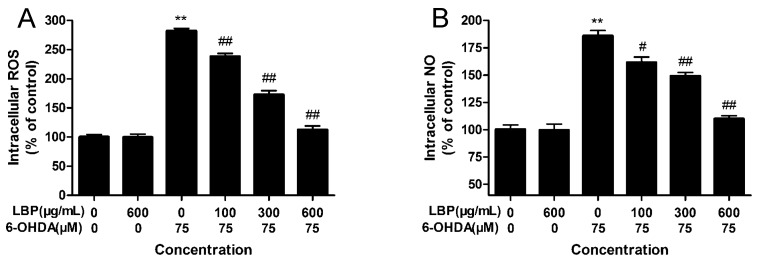
Figure 4.
Effect of LBP on 6-OHDA-induced accumulation of intracellular ROS (A) and NO (B) levels. Cells were exposed to 6-OHDA without or with different concentrations of LBP for 24 h. Data are expressed as percentage of untreated control cells ± SD (n = 6). ** p < 0.01 compared with untreated control cells; # p < 0.05, ## p < 0.01 compared with 6-OHDA-treated cells.

