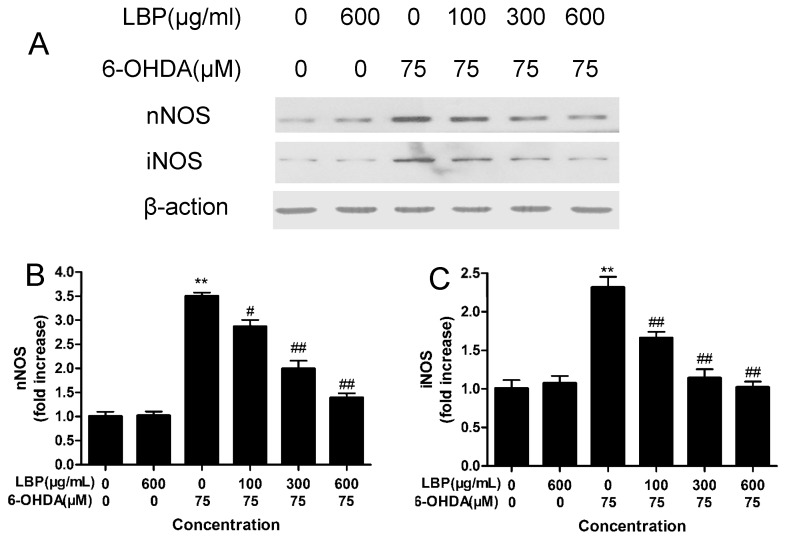
Figure 6.
Effect of LBP and 6-OHDA on the expression of nNOS and iNOS. PC12 cells were exposed to 6-OHDA (75 μM) with or without various concentrations of LBP for 24 h, and the nNOS and iNOS were detected by western blot (A); The protein levels and date analysis for nNOS (B) and iNOS (C); Data obtained from quantitative densitometry were presented as mean ± SD for three independent experiments. ** p < 0.01 compared with untreated control cells; # p < 0.05, ## p < 0.01 compared with 6-OHDA-treated cells.

