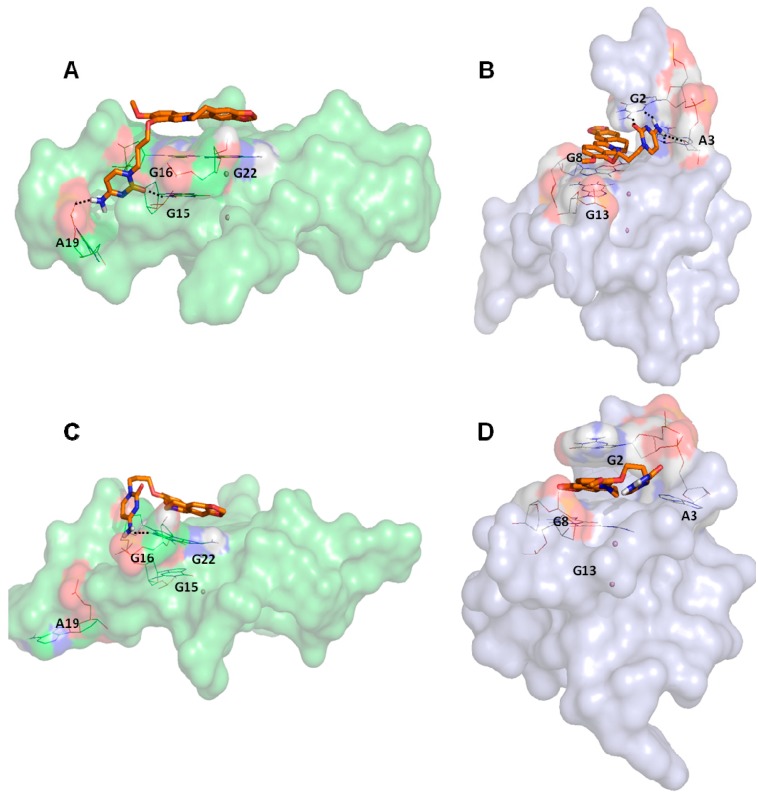
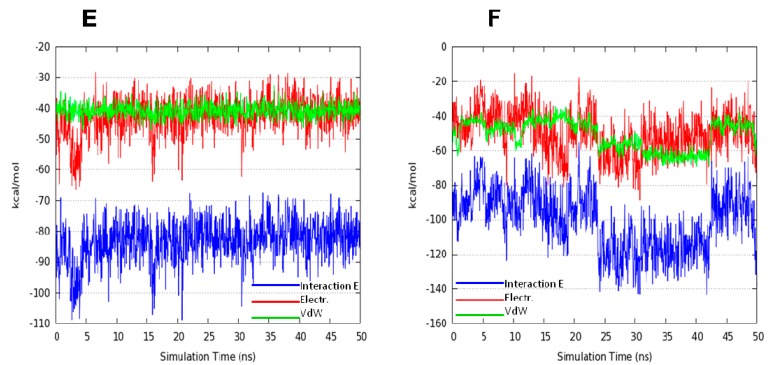
Figure 3.
Representation of the best pose after the docking simulations of the berberine derivative against (A) h-telo and (B) c-myc G4 structures. Representation of the most populated structure after the molecular dynamics simulations of the complexes between the berberine derivative and (C) h-telo and (D) c-myc G4 structures. The ligand is shown in orange carbon sticks, the nucleobases involved in hydrogen bonds, reported as black dashed lines, are represented in wireframe, while the coordinating cations are shown as purple spheres. Monitoring of the energy profile after 50 ns of MDs in terms of Interaction Energy (blue), electrostatic (red) and Van der Waal’s (green) contributions, in (E) h-telo and (F) c-myc G4 complexes. The energy values are expressed in kcal/mol.


