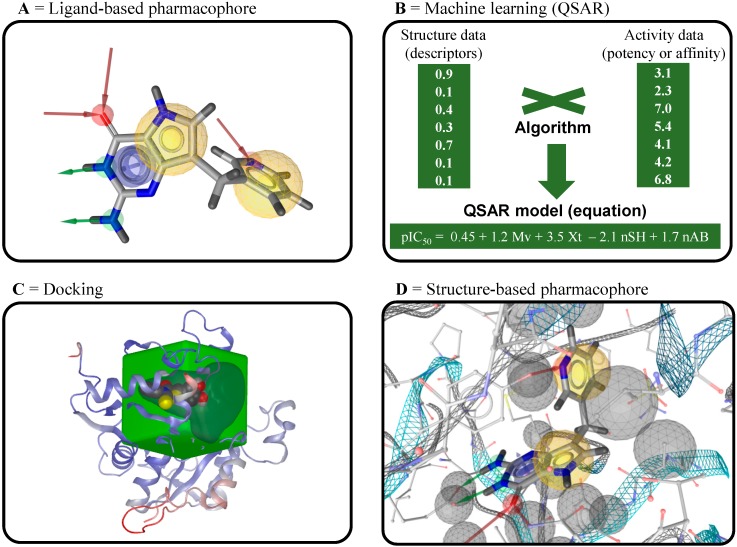
Figure 10.
Ligand- and structure-based tools used in virtual screening. (A,D) Representative pharmacophoric points used for construction of ligand- and structure-based pharmacophore models constructed using the LigandScout program. Hydrogen bond donors and acceptors are represented as green and red vectors, respectively; aromatic PI-interactions are represented by blue planes; lipophilic areas are represented as a set of yellow spheres; and steric constraints are represented by gray spheres; (B) Summary of the development of QSAR models from a set of known active and inactive compounds; (C) Representation of 3D coordinates of a binding site used for docking calculations in the OEDocking program.

