
Table 1.
Chemical structures and replicon assay results of compounds 1–17 a.
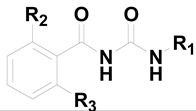
| Compound | R1 | R2 | R3 | Anti-HCV JFH1-2a Replicon Assay EC50 (μM) ± SD b |
|---|---|---|---|---|
| 1 |  |
OH | OH | 0.92 ± 0.12 |
| 2 |  |
OH | OH | >10 |
| 3 |  |
OH | OH | >50 |
| 4 |  |
OH | OH | >50 |
| 5 |  |
Cl | H | >50 |
| 6 |  |
NO2 | H | >50 |
| 7 |  |
CN | H | >50 |
| 8 |  |
F | H | 1.65 ± 0.32 |
| 9 |  |
CF3 | H | >10 |
| 10 |  |
MeS | H | >50 |
| 11 |  |
F | F | >50 |
| 12 |  |
F | MeS | >50 |
| 13 |  |
Cl | MeO | >50 |
| 14 |  |
 |
OH | 0.55 ± 0.03 |
| 15 |  |
 |
 |
0.46 ± 0.05 |
| 16 |  |
 |
OH | >20 |
| 17 |  |
 |
 |
>20 |
| CsA | 1.16 ± 0.14 |
a The synthesis and HPLC analysis data of 1–13 was according to reference [29]; the synthesis of 16–17 was described in the Supporting Information; The experimental method was described in the “Virus Assay” of the “Method”; b Each value indicates the mean ± SD of three independent experiments.