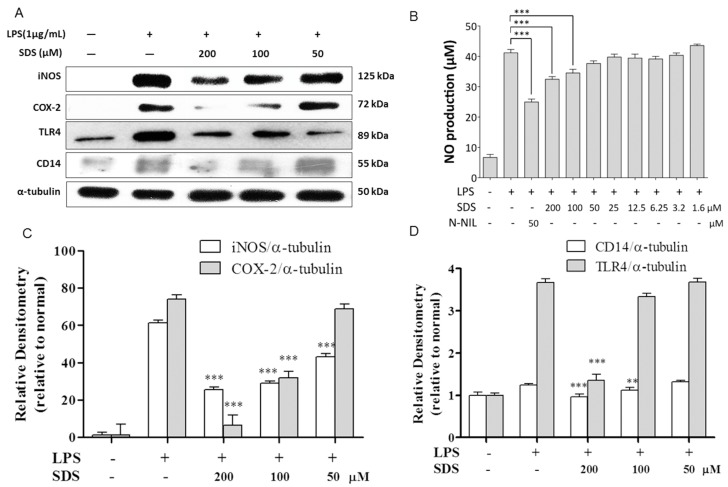
Figure 2.
Effect of SDS on LPS-induced expression of iNOS, COX-2 protein and NO production. RAW 264.7 cells were pretreated with various concentrations of SDS for 1 h, followed by stimulating with LPS (1 μg/mL) for 24 h. (A) Representative pictures of Western blots and (C,D) quantitative analysis of blots. Each immunoreactive band was digitized and expressed as a ratio of α-tubulin levels; (B) NO level was measured by Griess reaction. L-NIL (N6-(1-iminoethyl)-lysine, hydrochloride, 50 μM) was used as positive control. Data are expressed as mean ± SD of three independent experiments. ** p < 0.01, *** p < 0.001, versus LPS-stimulated cells.

