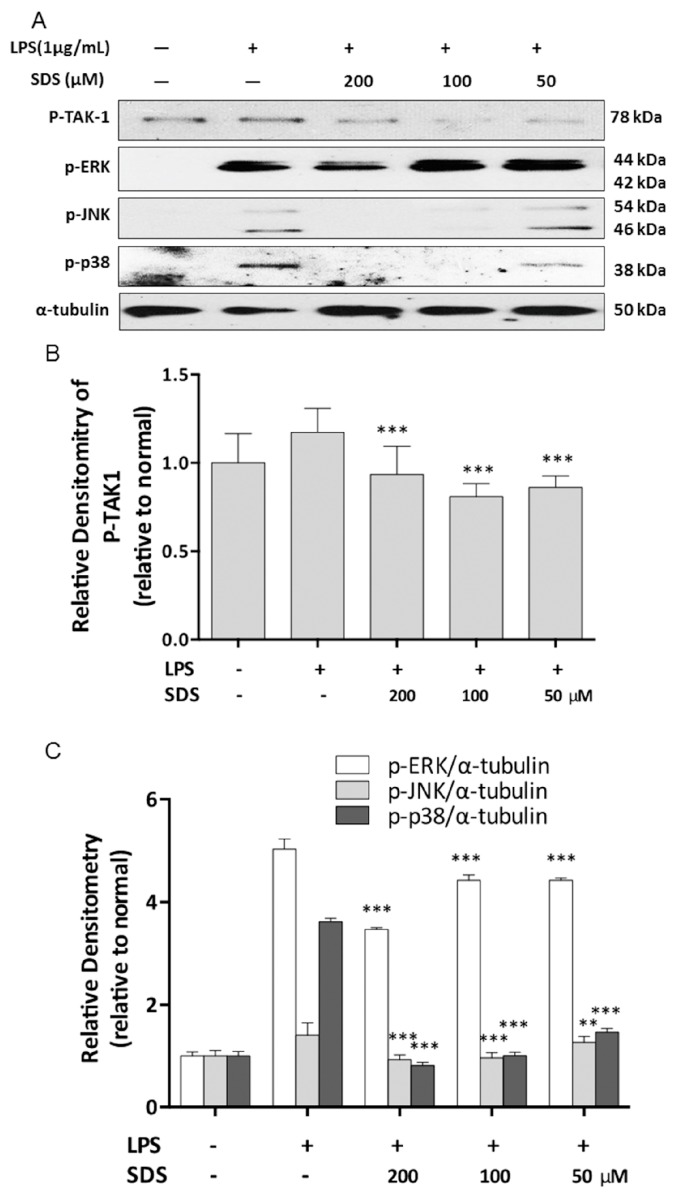
Figure 3.
Effect of SDS on LPS-induced phosphorylation of TAK1 and MAPK. RAW 264.7 cells were pretreated with various concentrations of SDS for 1 h, followed by stimulating with LPS (1 μg/mL) for 30 min. (A) Representative pictures of western blots and (B,C) quantitative analysis of blots. Data are expressed as mean ± SD of three independent experiments. ** p < 0.001, *** p < 0.001, versus LPS alone.

