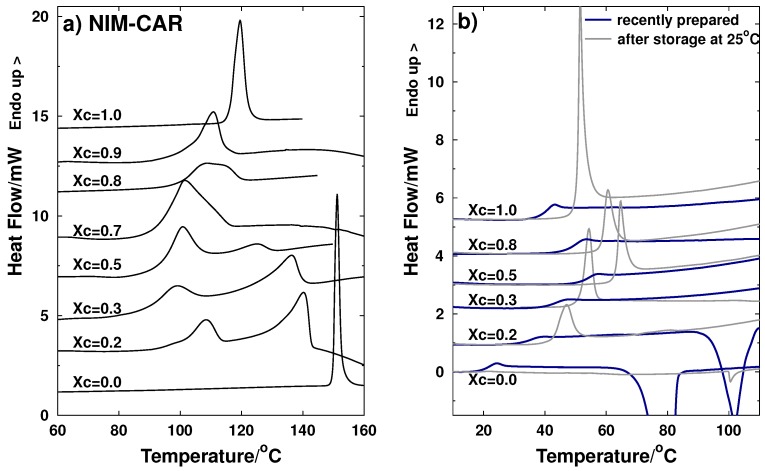
Figure 3.
Thermograms of the NIM-CAR binary system obtained by DSC. The mole fractions are expressed in terms of carvedilol () (a) crystalline samples (b) amorphous samples: plots with blue lines correspond to the measurement of the glass transition temperature performed immediately after the quenching of the molten sample. Thin gray lines correspond to the measurements carried out after 85 days of storage (at 25 C), except for sample in which storage time corresponds to 39 days . Heating rate was 10 C/min in all cases.

