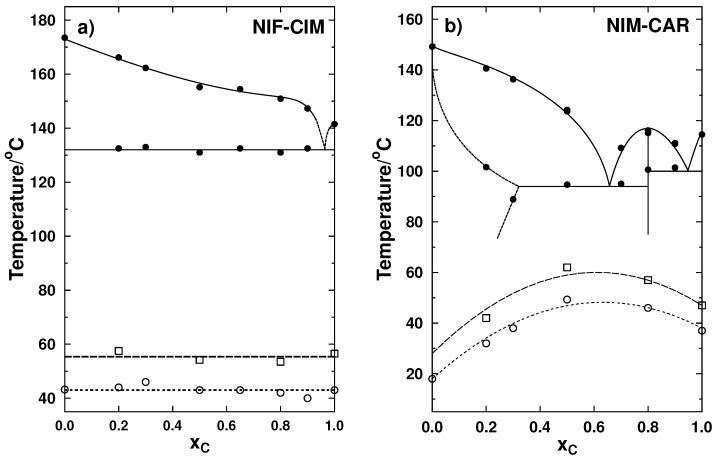
Figure 4.
Phase transition diagrams for the binary systems. Liquidus and eutectic temperatures are shown with filled circles. In the phase diagrams are also included the glass transition temperatures measured immediately after the quenching (empty circles) and after storage (empty squares) for (a) NIF-CIM showing glass transition temperatures at 0 and 133 days of storage and (b) NIM-CAR at 0 and 85 days of storage.

