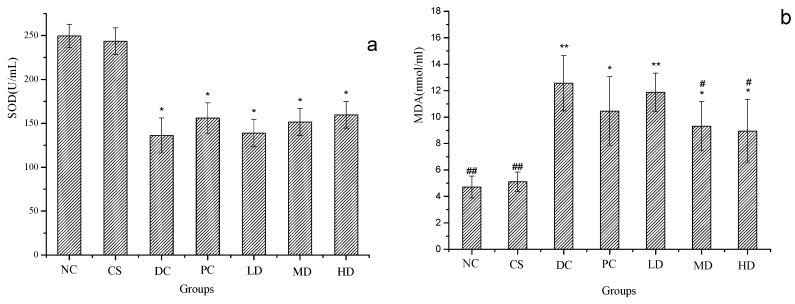
Figure 5.
SOD (a) and MDA (b) of normal and STZ induced diabetic mice. Results were presented as means ± SD (n = 10). The columns of each index have * p < 0.05, ** p < 0.01 vs. NC; # p < 0.05, ## p < 0.01 vs. DC. Group abbreviations are as given in the caption of Figure 1.

