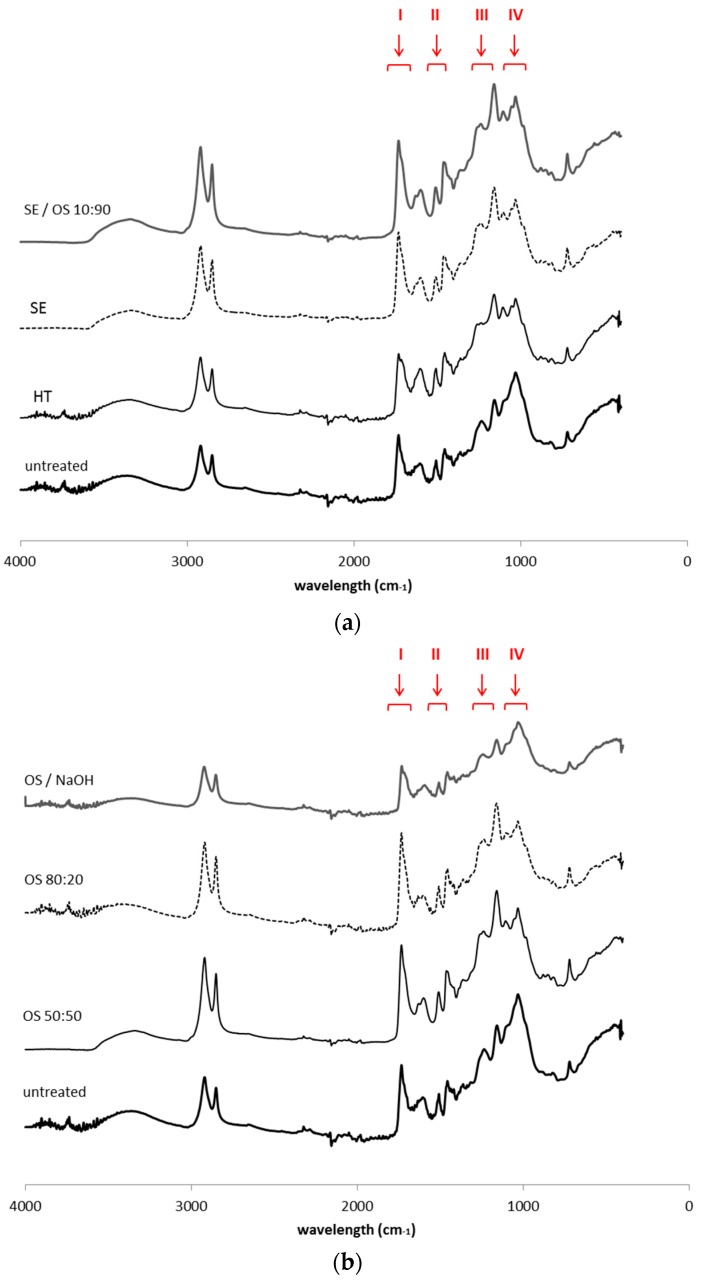
Figure 1.
ATR-FTIR spectra of extractive—free untreated and pretreated solid fractions from (a) hydrothermal and steam explosion pretreatments and (b) treatments with organic solvents. The following regions marked correspond to: (I) region 1740–1715 cm−1 that accounts for the ester groups (C=O stretch); (II) “lignin triplet” region, including the three characteristic bands at 1600–1400 cm−1, derived from C=C vibrations of the aromatic ring, (III) region 1265–1161 cm−1 for symmetric and asymmetric C–O–C stretching and (IV) region 1092–1034 cm−1 that accounts for C–H, C–O and –OH deformations.

