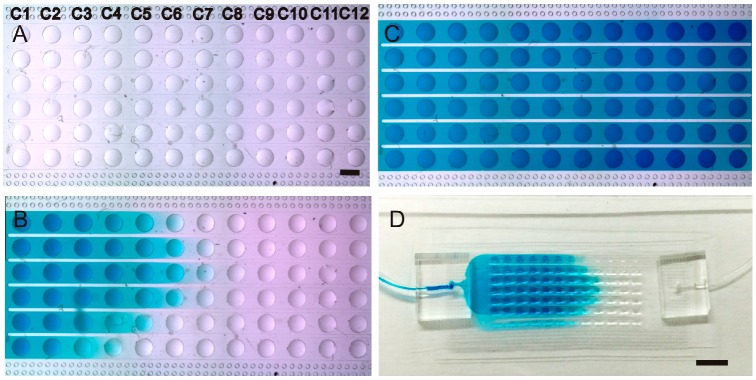
Figure 3.
Demonstration and characterization of solution exchange in μHD chip. (A–C) Photographs showing the solution replacement process (blue dye replacing DI water) at 0 min, 60 min and 100 min, respectively. Scale bar = 1 mm; (D) photograph of the whole chip taken at 80 min after the replacement process started. Scale bar = 4 cm; (E) the relationship between the normalized intensity of the blue dye solution and the time after the replacement process started.


