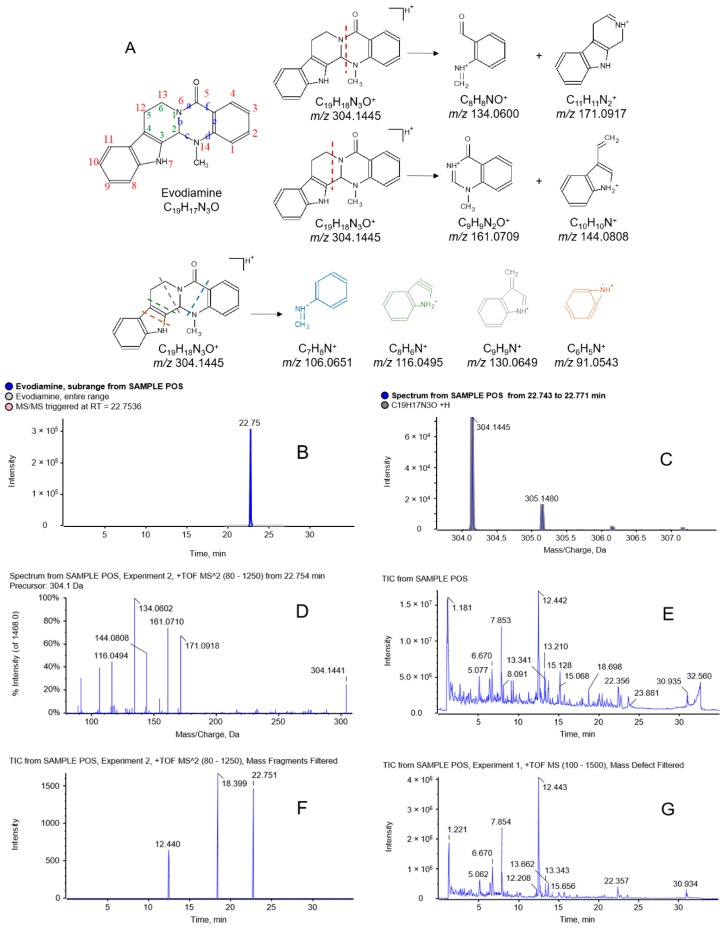
Figure 2.
Fragmentation pattern of evodiamine and its analogous alkaloids. (A) Structure and fragmentation pathways of evodiamine, (B) XIC of evodiamine, (C) precursor ion TOF MS spectrum of evodiamine, (D) product ion MS/MS spectrum of evodiamine, (E) TIC of TOF MS scan of WZYD in positive ion mode, (F) TIC of CID experiment 2 after fragment filtering, and (G) TIC of TOF MS scan after MDF.

