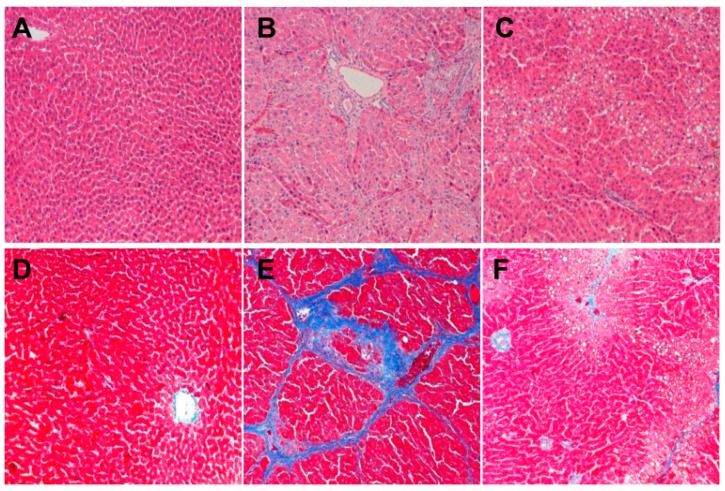
Figure 2.
Liver histological changes induced by CCl4 overload and the effects of JGG treatment in rats. Representative microscopic photographs (original magnification: ×100) were obtained from: (A) HE staining of the control group; (B) HE staining of the CCl4 model group; (C) HE staining of the JGG intervention group; (D) Mallory staining of the control group; (E) Mallory staining of the CCl4 model group; (F) Mallory staining of the JGG intervention group.

