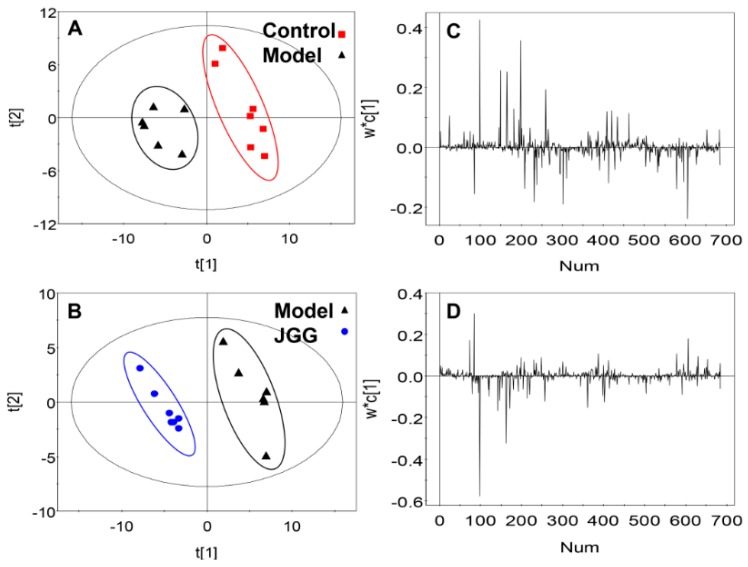
Figure 5.
Score plot of the pairwise comparison between (A) the control vs. the CCl4 model group. R2X (cum) = 0.494, R2Y (cum) = 0.928, Q2 (cum) = 0.725; (B) JGG vs. the CCl4 model group. R2X(cum) = 0.463, R2Y (cum) = 0.974, Q2 (cum) = 0.827. Loading plot of the pairwise comparison between (C) the control vs. CCl4 model group and (D) JGG vs. the CCl4 model group. NUM is the abbreviation of Number. The ellipses are only for easier data visualization.

