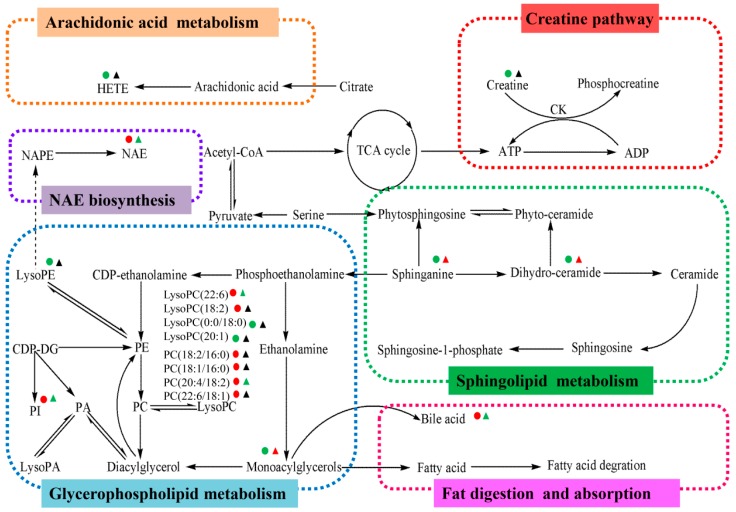
Figure 8.
Metabolic pathway of CCl4-induced liver fibrosis and the anti-fibrotic effects of JGG. Content change tendencies are expressed according to the color: red, significant increases (p < 0.05); green, significant decreases: (p < 0.05); black, no significant changes (p > 0.05). The model group compared to the control group; the JGG group compared to the model group.

