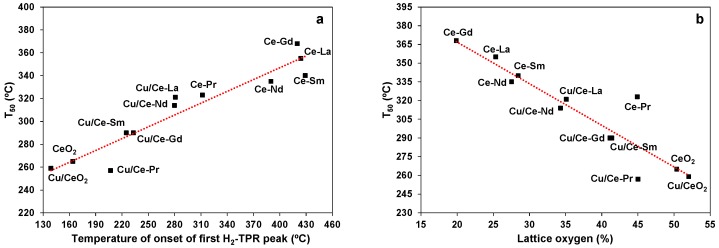
Figure 10.
Correlation of 50% conversion temperature (T50) with: (a) the onset temperature of the first H2-TPR peak and (b) the amount of lattice oxygen for Ce-Ln and Cu/Ce-Ln samples (Ln: Gd, La, Pr, Nd, Sm). The error for catalytic experiments is ±2 °C, for TPRs ±5 °C and for lattice oxygen amount ±2%.

