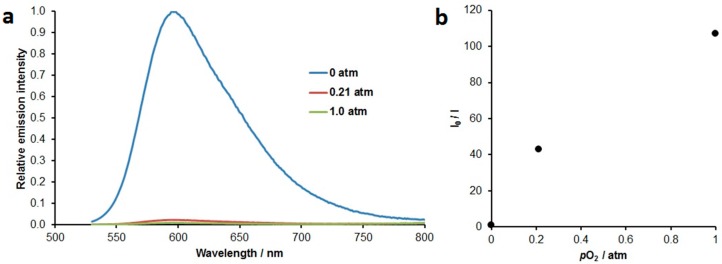
Figure 2.
(a) Relative oxygen dependent emission spectra for 1 in acetonitrile (normalized for deoxygenated (vacuum) conditions) and (b) Stern-Volmer plot (I0 and I are the emission intensities at λmax for the degassed solution and solution at the partial pressure of oxygen at which emission is measured respectively).

