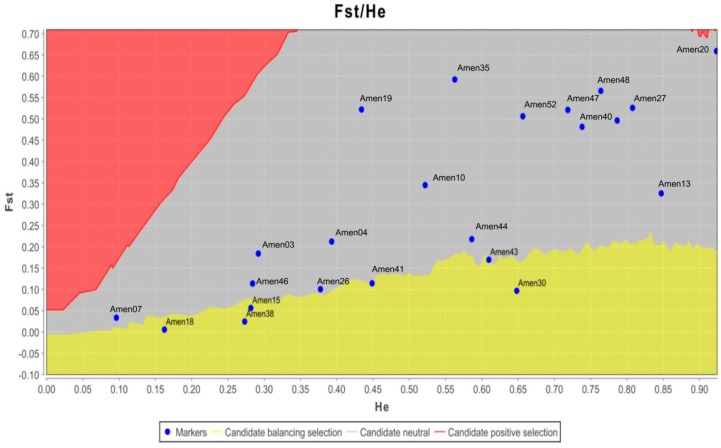
Figure 3.
Assessment of outlier EST-SSR loci using LOSITAN software, which evaluated the expected distribution of the Wright inbreeding coefficient (Fst) and expected heterozygosity (He) by applying an island model of migration along with neutral markers. The five loci, Amen15, Amen18, Amen30, Amen38, and Amen43, were identified as outliers. Dots in the red and yellow areas represent candidate loci for positive or balanced selection.

