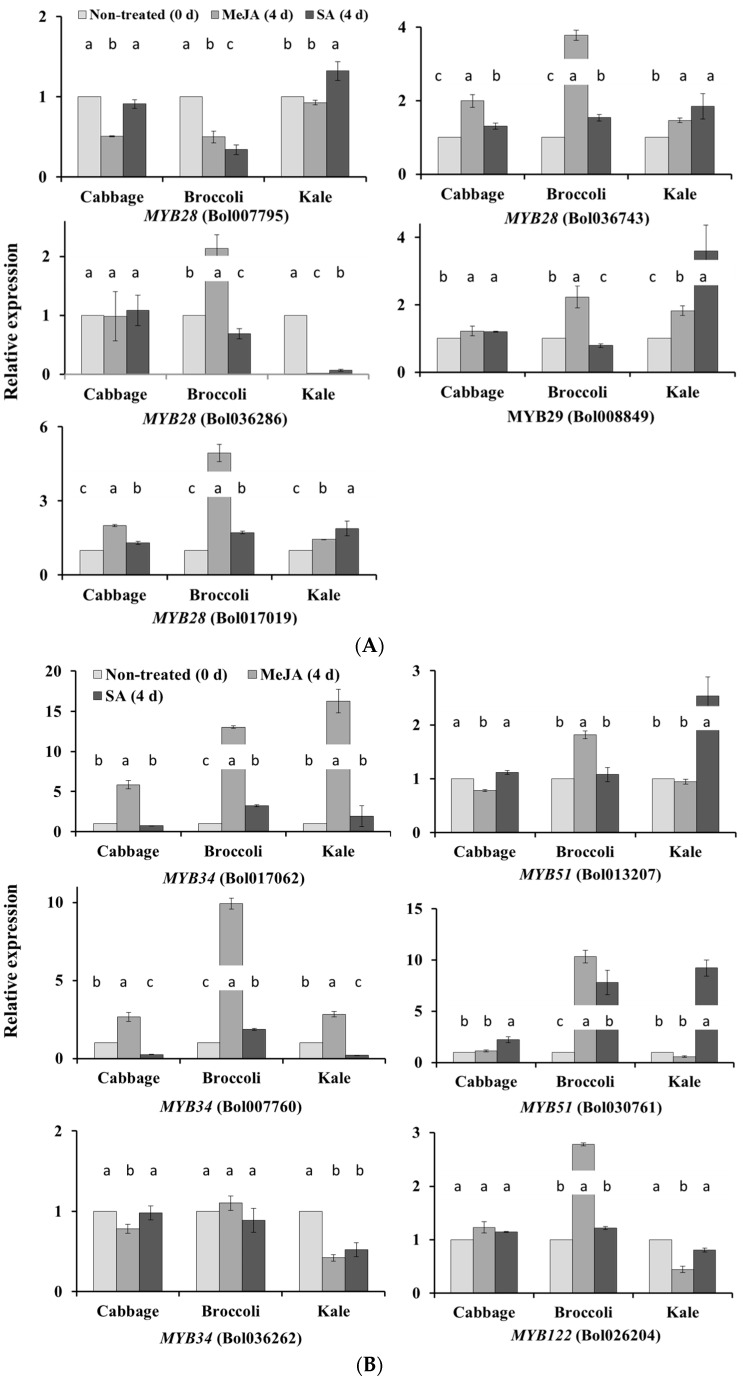
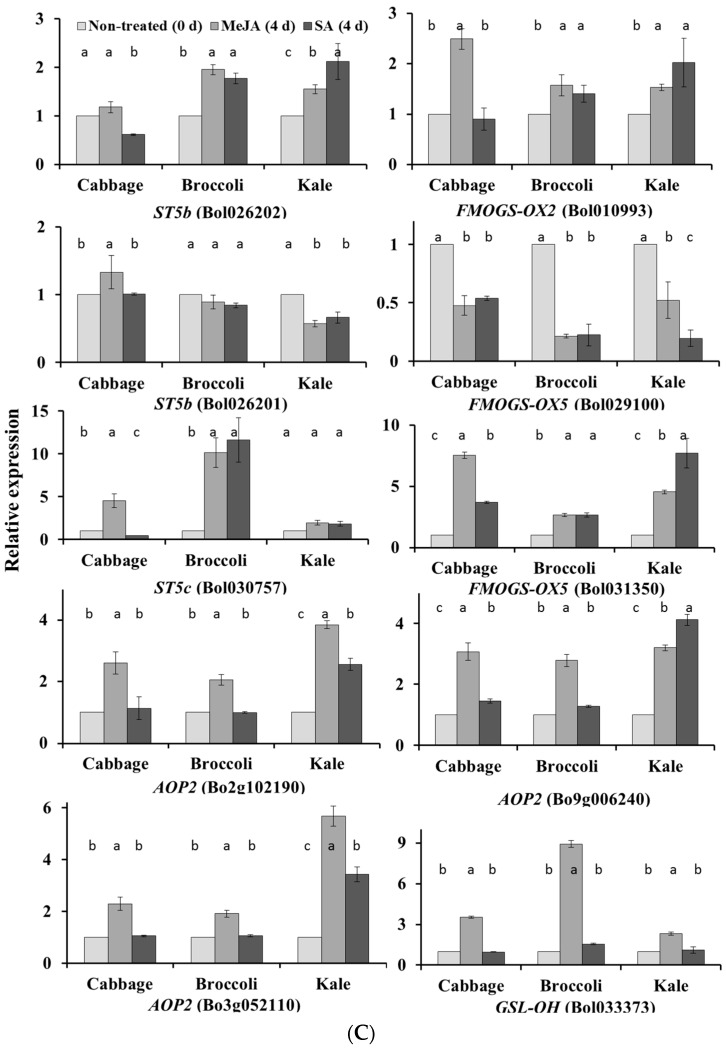
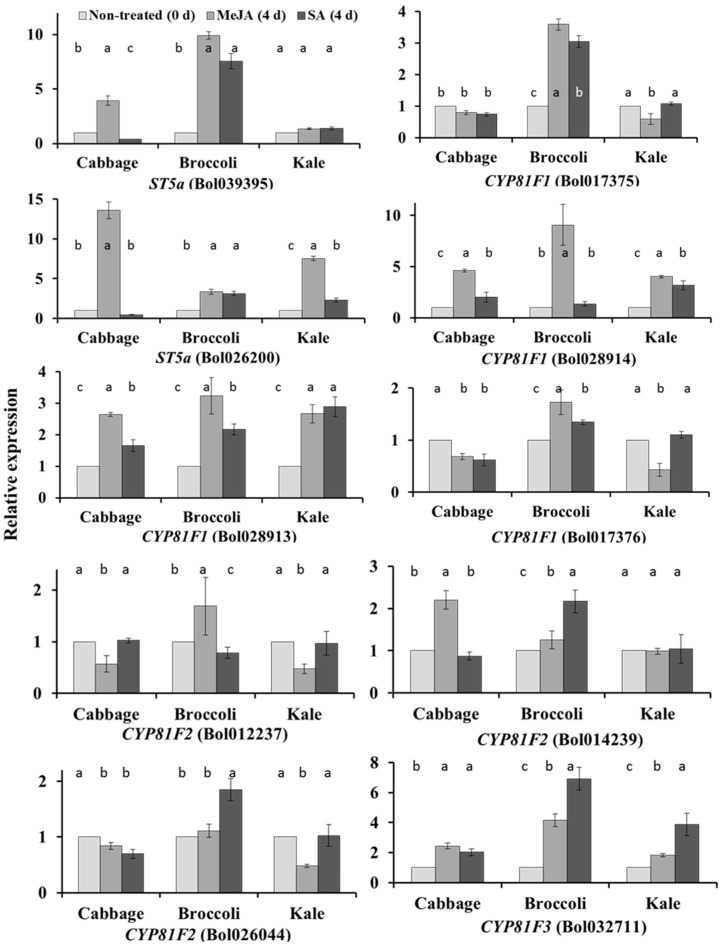
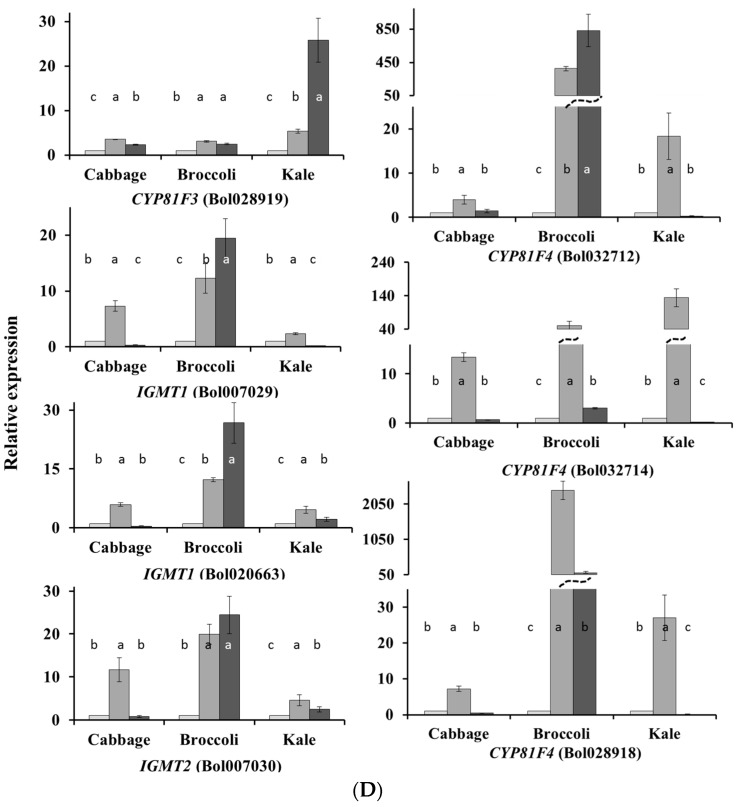
Figure 2.
Quantitative PCR analyses of the expression of glucosinolate biosynthesis genes under the exogenous application of MeJA and SA. Expression was normalized to that of actin and the values in control plants were set to 1. Each data point is the average for each of the three biological replicates with three technical replicates against each biological replicate. Vertical bars indicate standard deviation of the means. Different letters indicate statistically significant difference (p < 0.01). (A) Relative expression analyses of five aliphatic transcription factor-related genes; (B) Relative expression analyses of six indolic transcription factor-related genes; (C) Relative expression analyses of 10 aliphatic glucosinolate biosynthesis-related genes; (D) Relative expression analyses of 17 indolic glucosinolate biosynthesis-related genes.


