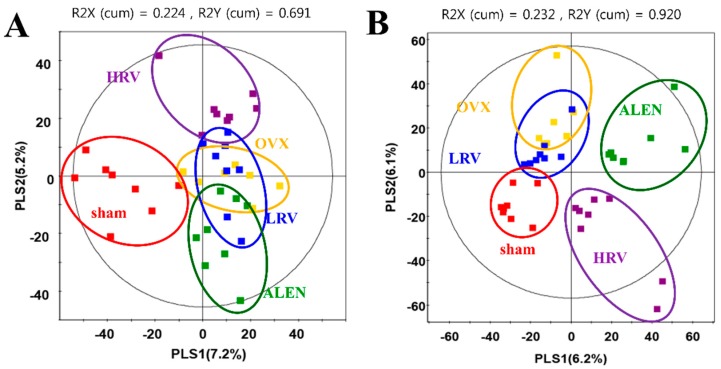
Figure 3.
Partial least-squares discriminant analysis (PLS-DA) score plots derived from the GC-TOF-MS (A) and UPLC-Q-TOF-MS (B) data of ovariectomized rat groups. (; sham-operated control, ; ovariectomized rat without treatment, ; ovariectomized rat treated with low-dose RC vinegar, ; ovariectomized rat treated with high-dose RC vinegar, ; ovariectomized rat treated with alendronate).

