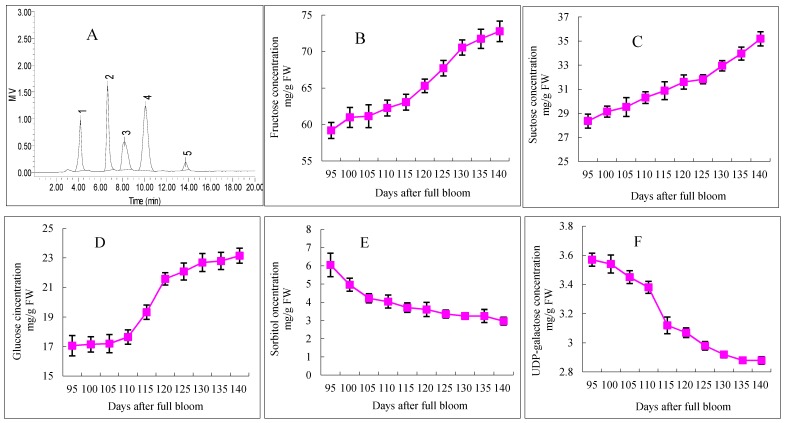
Figure 3.
HPLC separation and concentration changes of soluble sugars in “Starkrimson” apple flesh during ripening period. (A) “Starkrimson” apple peel monitored by refractive index (RI) detector. Peaks: 1 UDP-galactose; 2 fructose; 3 sucrose; 4 glucose; 5 sorbitol; b, c and d values are means ± SE (n = 4); (B–F) concentration and changes of fructose, sucrose, glucose, sorbitol and UDP-galactose in “Starkrimson” apple peel during ripening period.

