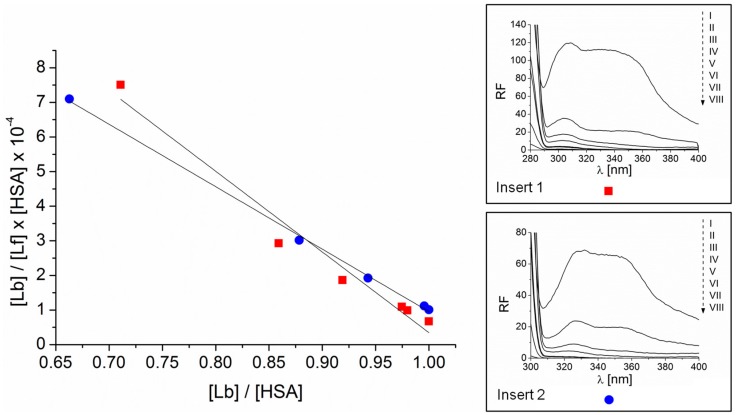
Figure 4.
Scatchard dependence for the PpIX-HSA complex excited at 280 nm () (y = −23.317x + 23.663) and 295 nm () (y = −18.44x + 18.999). Data determined from emission fluorescence spectra. In the insert 1: fluorescence emission spectra of HSA at concentration 7.5 × 10⁻⁷ M (I) and HSA in the presence of increasing PpIX concentration in range from 1 × 10⁻⁵ M to 3 × 10⁻⁴ M (II, III, IV, V, VI, VII, VIII) excited at 280 nm. In the insert 2: fluorescence emission spectra of HSA at concentration 1 × 10⁻⁶ M (I) and HSA in the presence of increasing PpIX concentration in range from 1 × 10⁻⁵ M to 3 × 10⁻⁴ M (II, III, IV, V, VI, VII, VIII) excited at 295 nm. [Lb], bound ligand concentration; [Lf], free ligand concentration.

