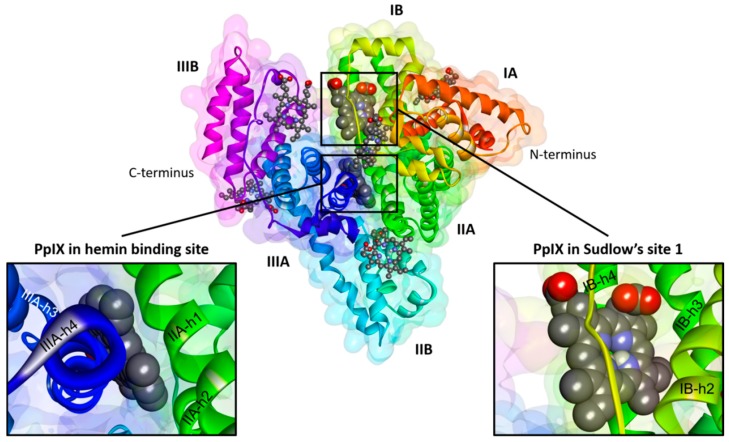
Figure 8.
Macromolecule of HSA (PDB 1AO6) complexed with the PpIX molecules. The protein backbone is shown schematically as a ribbon. Each subdomain of HSA is marked according to the model proposed by Carter and Ho [14]. The best docking results (number 1 and 2) are shown in the CPK representation. Other docking results are shown in the ball and stick representation. For the sake of clarity, only polar hydrogen atoms are displayed.

