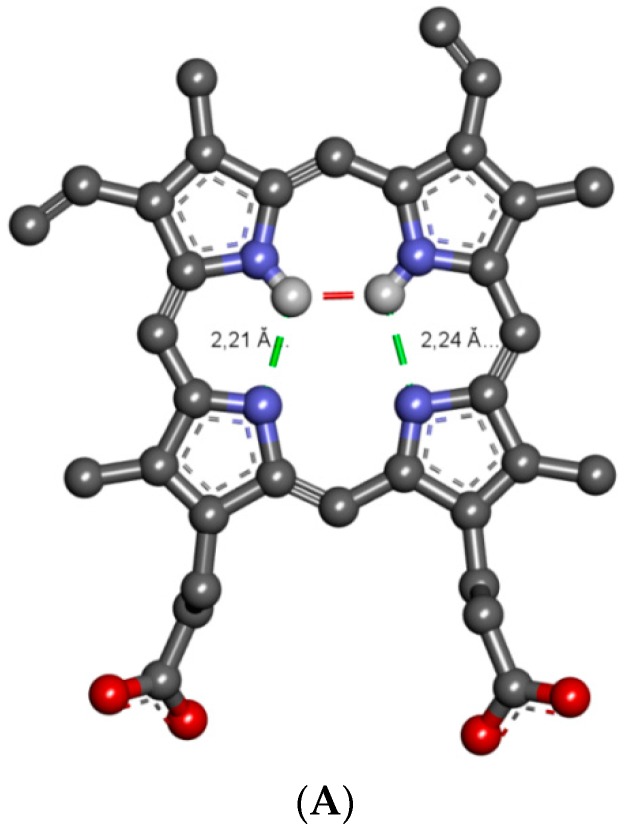
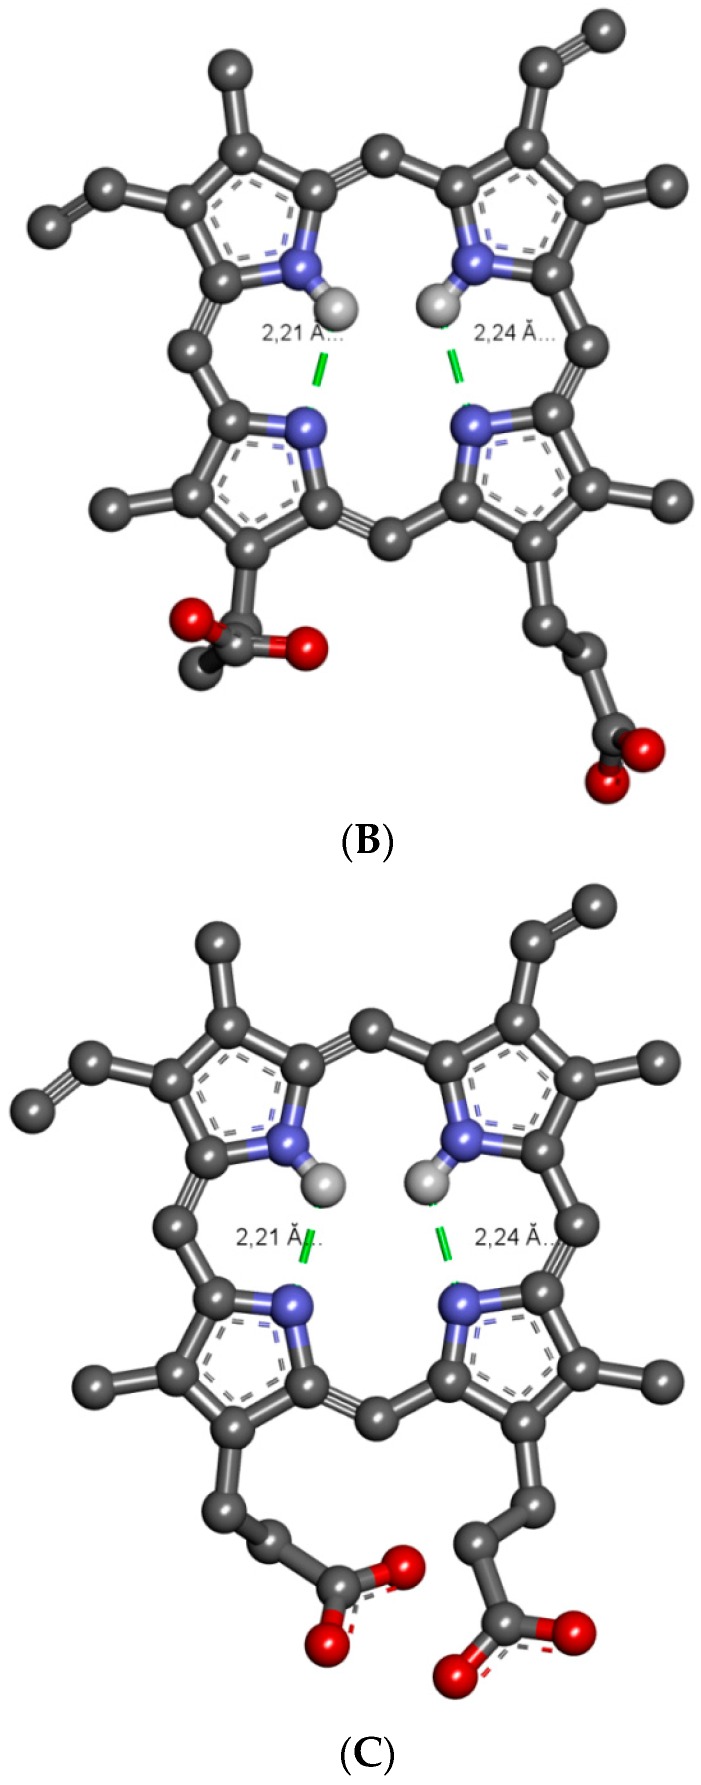
Figure 12.
The differences in molecular conformations of PpIX before and after computational simulation. (A) Initial conformation of PpIX; (B) conformation of PpIX bound in the hemin site; (C) conformation of PpIX bound in Sudlow’s Site 1. Molecules are shown in the ball and stick representation of their aromatic forms. Intramolecular hydrogen bonds are highlighted with dashed lines (1 Å = 0.1 nm). For the sake of clarity, only polar hydrogen atoms are displayed.


