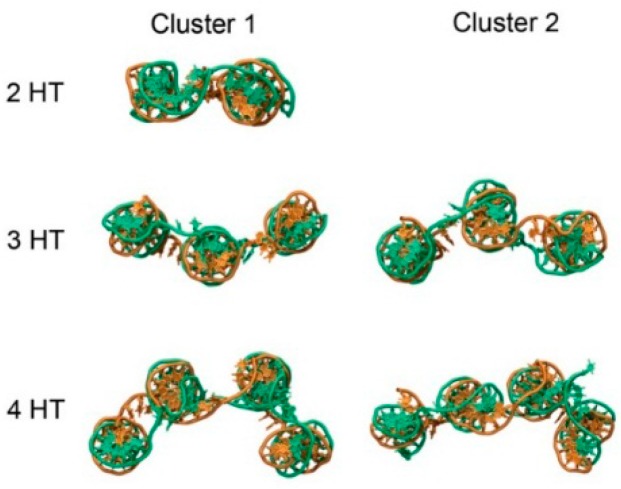
Figure 4.
Snapshots showing representative structures of the first two conformational clusters from MD trajectories of weave tiles. According to the clustering metric used, 2HT had a total of 1 cluster, the 3HT had 5 and the 4HT had 7. The first cluster (Cluster 1) is the most common conformation of the tile, while Cluster 2 is the second most common conformation observed during simulations.

