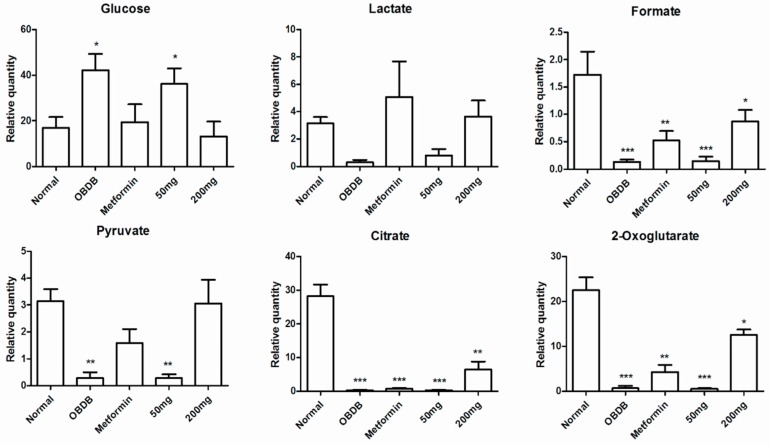
Figure 5.
Relative quantification of the differentiating metabolites in urine samples (urine samples collected at final stage) of normal, obese–diabetic (obdb), and obese–diabetic rats treated with 50 or 200 mg of A. paniculata extract or with metformin. Relative quantification is based on mean peak area of the related 1H-NMR signals. * depicts the differences between normal (control), obese–diabetic (obdb), and obese-–diabetic rats treated with different concentrations of A. paniculata extract or metformin. Statistical icons: * p < 0.05, ** p < 0.01 and *** p < 0.001.


