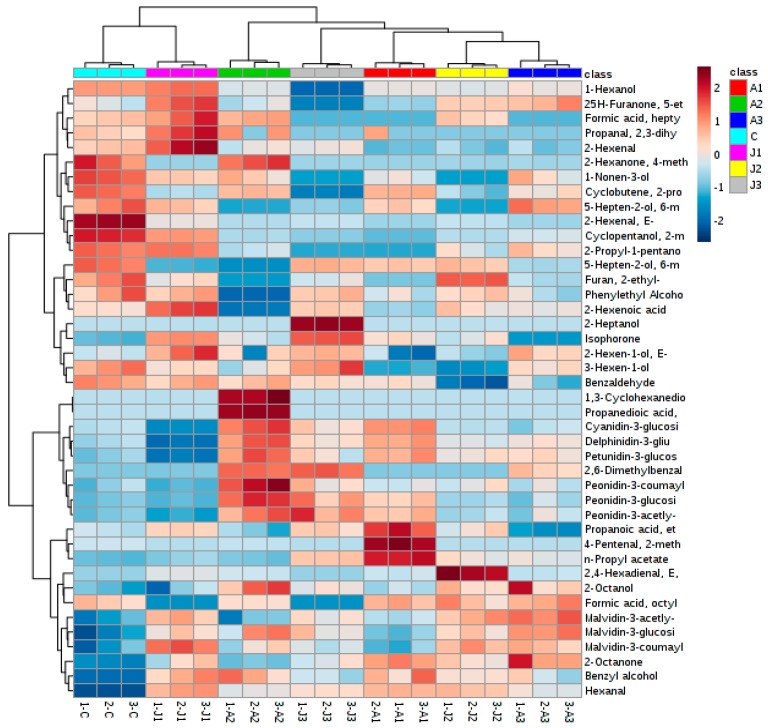
Figure 1.
Heat map of anthocyanins and volatile aromas after different treatments. A1: treatment with 1000 mg·L−1 ABA; A2: treatment with 600 mg·L−1 ABA; A3: treatment with 200 mg·L−1 ABA; J1: treatment with 800 µmol·L−1 MeJA; J2: treatment with 200 µmol·L−1 MeJA; J3: treatment with 50 µmol·L−1 MeJA; C: control. Values are the mean of three replicates (±standard deviation). The heat map graphic distances were measured using Euclidean distances, and the clustering algorithm using ward dendrogram. Each colored cell on the map corresponds to a concentration value (normalized to the control sample).

