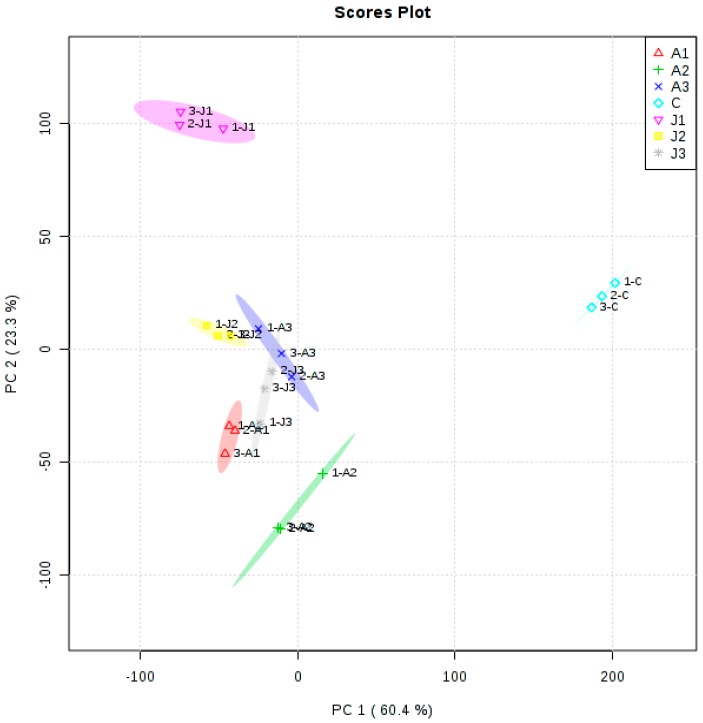
Figure 4.
PCA scores plot of samples after different treatments. The colored dots represent samples from different treatments. Seven independent treatment studies, each with triplicate samples, were used in the analysis. A1: treatment with 1000 mg·L−1 ABA; A2: treatment with 600 mg·L−1 ABA; A3: treatment with 200 mg·L−1 ABA; J1: treatment with 800 µmol·L−1 MeJA; J2: treatment with 200 µmol·L−1 MeJA; J3: treatment with 50 µmol·L−1 MeJA; C: control.

