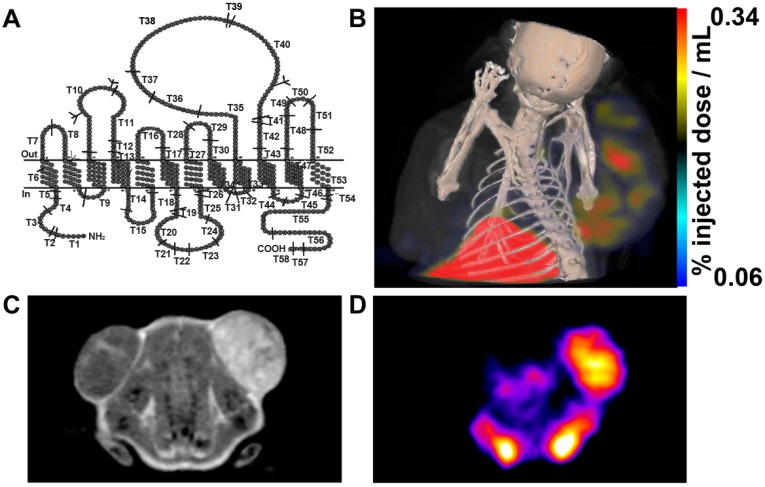
Figure 5.
Oatp1 expression was detected using MRI and SPECT by Drs. Patrick and Xiao et al. (A) Predicted structure of oatp1a1; (B) SPECT-CT image of 111In-EOB-DTPA injected mouse. The xenograft on the left flank was a control and the xenograft on the right flank expressed Oatp1; (C) T1-weighted MR image of Gd-EOB-DTPA injected mouse; (D) SPECT image of the 111In-EOB-DTPA injected mouse [79,85].

