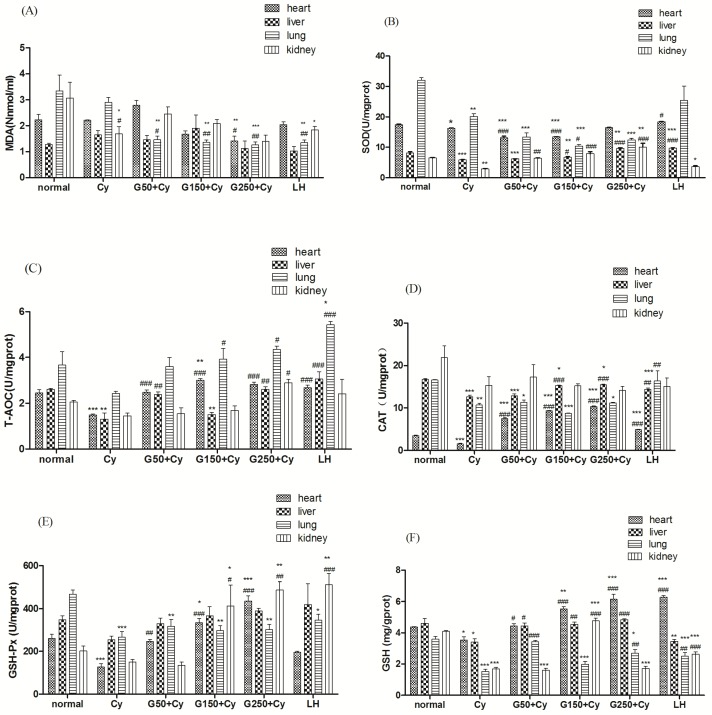
Figure 6.
Effect of GPMPP on the (A) MDA level, and the activities of (B) SOD; (C) T-AOC; (D) CAT; (E) GSH-Px and (F) GSH in the heart, liver, lung and kidney of Cy-immunosuppressed mice. * p < 0.05, ** p < 0.01, *** p < 0.001, compared with normal control. # p < 0.05,## p < 0.01,### p < 0.001, compared with model control. Values are means ± SD, n = 10.

