Figure 4.
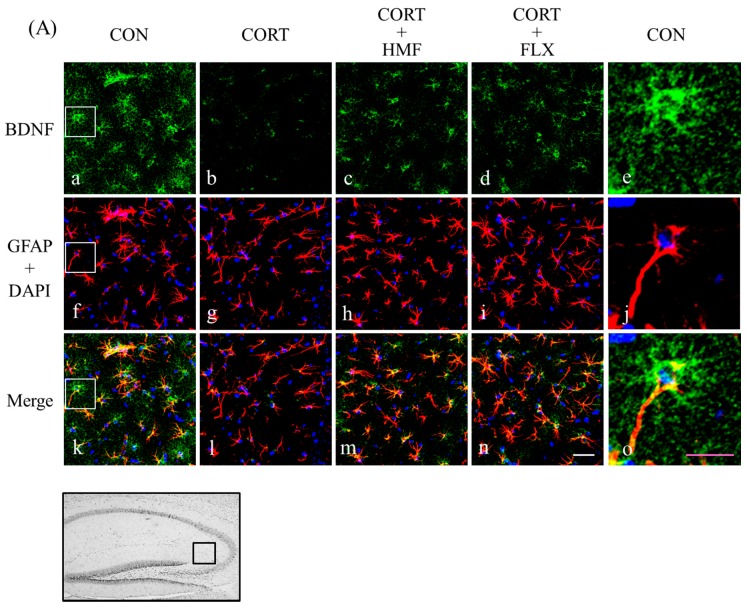
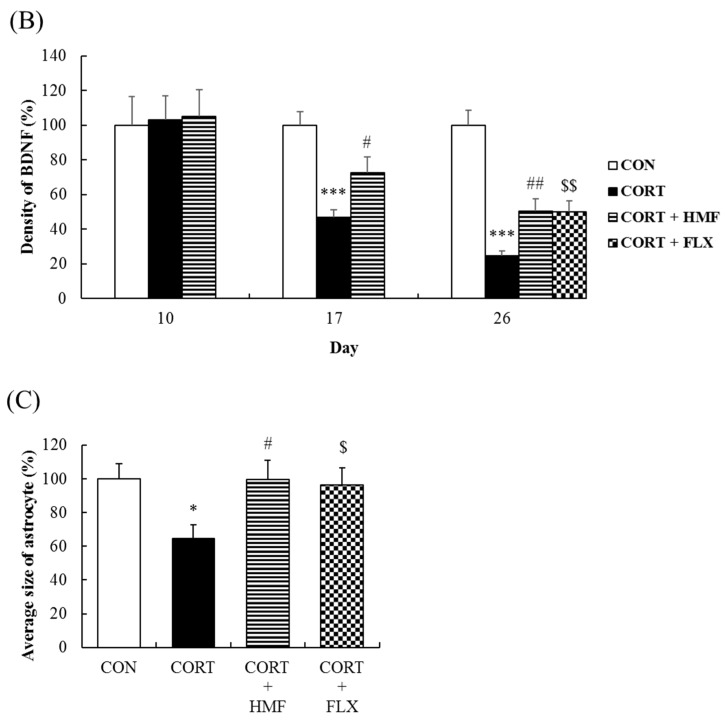
Effects of HMF on the expression of BDNF and GFAP immunoreactivity in the corticosterone-induced depressive mouse hippocampus. (A) Sagittal sections on Day 26 after continuous corticosterone injections were stained with specific antibodies, either anti-BDNF (green; a, b, c, d, e) or anti-GFAP with DAPI staining (red and blue, respectively; f, g, h, i, j). Each signal was merged in k, l, m, n and o, respectively. White squares in the CON group showed a typical astrocyte expressing BDNF, and each high-power magnification picture was shown as e, j, and o. The white and the pink scale bar show 50 µm and 25 µm, respectively. The location of the captured images in the hippocampus and quantification is shown with a square (0.22 mm2). (B) A quantitative analysis of BDNF-positive signal densities using ImageJ software. Values are means ± SEM (Day 10; n = 4, Day 17; n = 8, Day 26; n = 8–10). Symbols show significant differences between the following conditions: CON vs. CORT (*** p < 0.001), CORT vs. CORT + HMF (# p < 0.05, ## p < 0.01), and CORT vs. CORT + FLX ($$ p < 0.01). A quantitative analysis of the average size (C) of GFAP-positive signals on Day 26 using ImageJ software. Values are means ± SEM (n = 8–10). Symbols show significant differences between the following conditions: CON vs. CORT (* p < 0.05), CORT vs. CORT + HMF (# p < 0.05), and CORT vs. CORT + FLX ($ p < 0.05).


