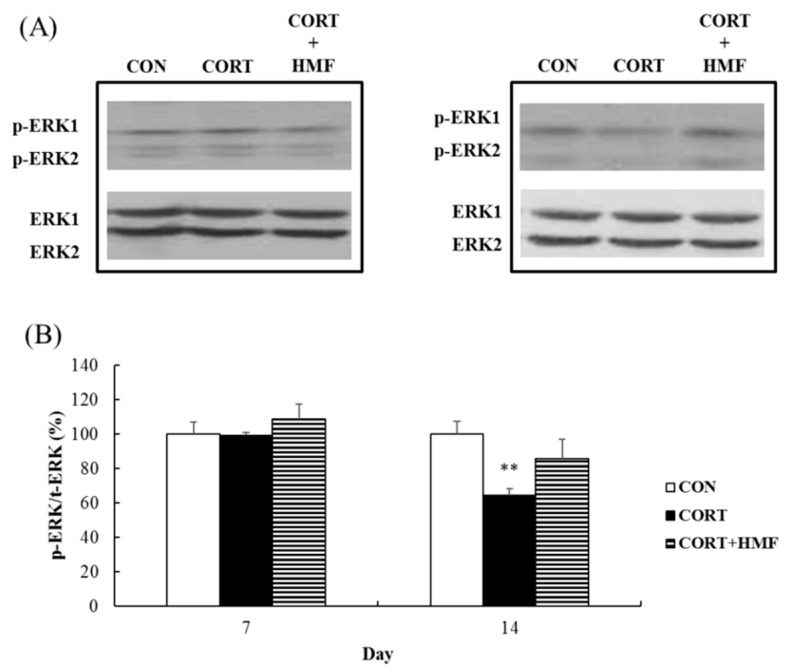
Figure 7.
A Western blot analysis of the influence of HMF on the expression of phosphorylated ERK in the corticosterone-induced depressive mouse hippocampus. (A) Representative band patterns of p-ERK1/2 and ERK1/2. (B) A quantitative analysis of the p-ERK/ERK ratio using ImageJ software. Values are means ± SEM (Day 10; n = 4, Day 17; n = 5). Symbols show significant differences between the following conditions: CON vs. CORT (** p < 0.01).

