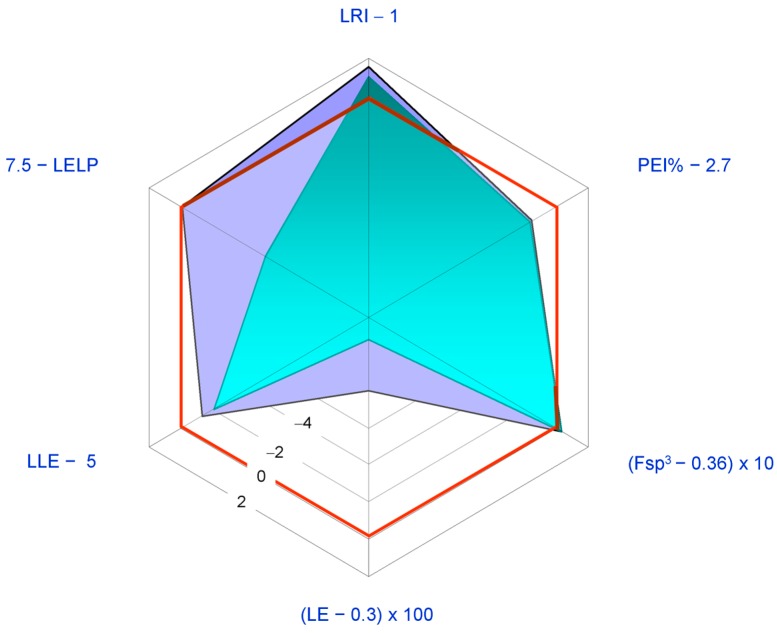
Figure 8.
Radar plot of ligand efficiency metrics as a graphical tool to assess developability of limonin (1, purple area) and nomilin (2, blue-green area) as drugs. Sub-optimal property space corresponds to the inner hexagon showing red sides marked with “zero”. Ideally, good lead compounds would be represented by areas wider than this inner hexagon. This spider plot indicates that 1 should be preferred to 2 as a lead compound. Legend: Fsp3: fraction sp3; LRI: heterocycles/carbocycles ratio; PEI: potency efficiency index; LE: ligand efficiency; LLE: lipophilic ligand efficiency; LELP: ligand efficiency dependent lipophilicity; see text for details.

