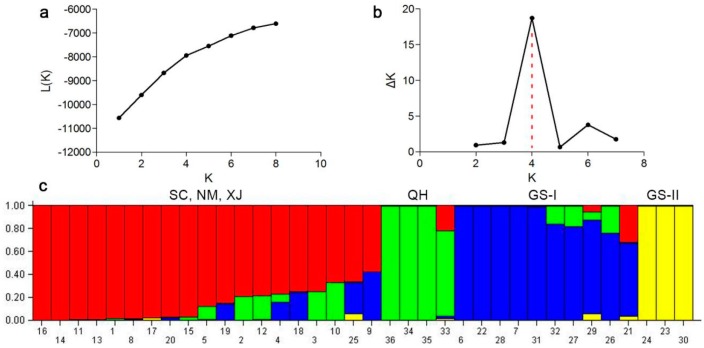
Figure 2.
Four groups of 36 E. sibiricus accessions inferred from STRUCTURE analysis and the description of detected the optimum value of K by using graphical method. (a) Mean L (K) over 20 runs for each K value; (b) Maximum delta K (△K) values were used to determine the uppermost level of structure for K ranging from 2 to 7, here K is four and four clusters; (c) The vertical coordinate of each group indicates the membership coefficients for each accessions. Red zone: SC, NM and XJ; Green zone: QH; Blue zone: GS-I; Yellow zone: GS-II.

