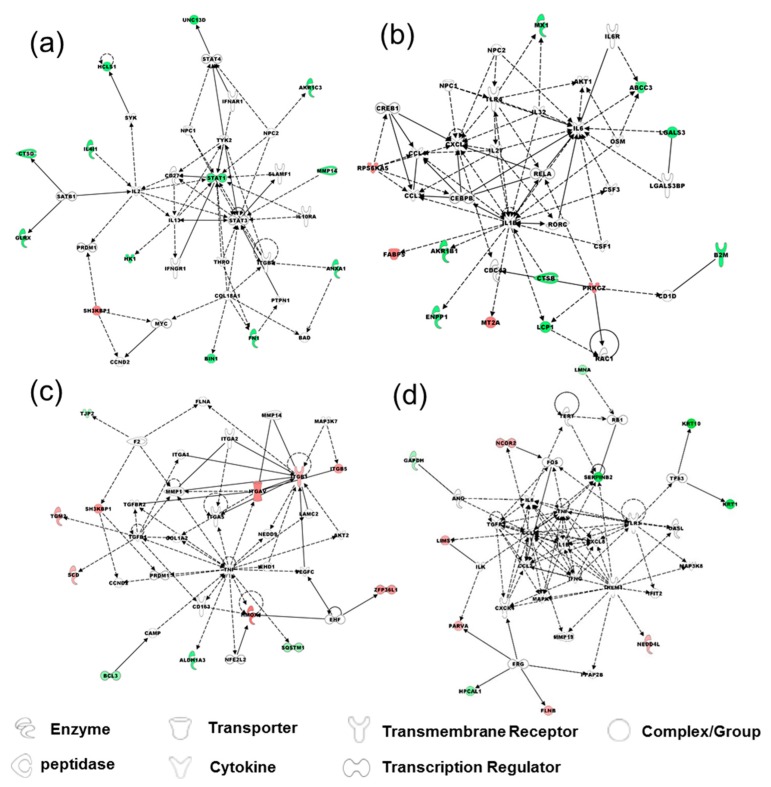
Figure 4.
Functional network analysis of differentially regulated proteins with z-score cutoff 95% observed in EMT of HCV29 and KK47 cells, using Ingenuity Pathways Analysis (IPA). Top network functions of (a) cellular development, cellular growth and proliferation, hematological system development and function; (b) cell death and survival, cell morphology, cellular development in TGF-β-induced EMT of HCV29. Top network functions of (c) cancer, cellular movement, tumor morphology; (d) cell-to-cell signaling and interaction, tissue development, cell death and survival. Solid lines: direct known interactions. Dashed lines: suspected or indirect interactions. White: proteins known to be in the network but not identified in our study. Red: proteins upregulated in the EMT process. Green: proteins downregulated in the EMT process.

