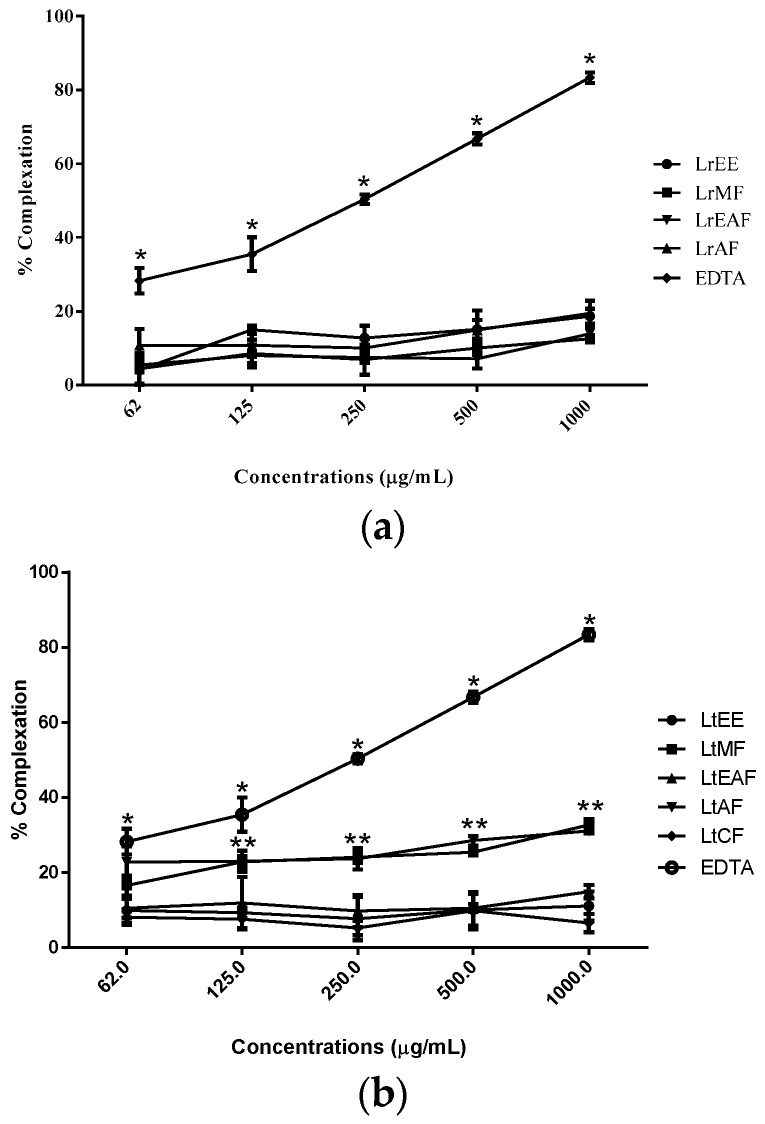
Figure 2.
Iron chelating activity of Licania rigida (a) and L. tomentosa (b) seeds ethanolic extract and their fractions based on o-phenantroline method. Absorbance was recorded at 510 nm and percent complexation was calculated with respect to control (determined in the absence of samples and EDTA). LrEE = L. rigida ethanolic extract; LrMF = L. rigida methanolic fraction; LrEAF = L. rigida ethyl acetate fraction; LrAF = L. rigida aqueous fraction LtEE = L. tomentosa ethanolic extract; LtMF = L. tomentosa methanolic fraction; LtEAF = L. tomentosa ethyl acetate fraction; LtAF = L. tomentosa aqueous fraction; LtCF = L. tomentosa chloroform fraction; EDTA = Ethylenediamine tetraacetic acid. * Significant difference between EDTA control and all the samples in A and B (p < 0.05). ** Significant difference between LtMF/LtAF and other samples in B (p < 0.05).

