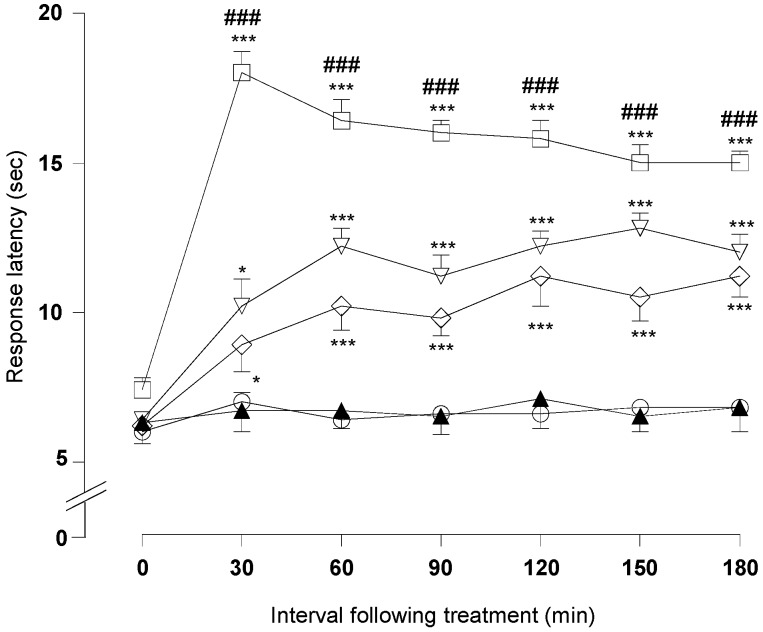
Figure 8.
Effect of treatment with opioid antagonist, naloxone on the hot plate test in mice. Results are expressed in mean ± S.E.M. of response latency (s) of 6 mice. Statistical significance was denoted by one-way ANOVA followed by Dunnett’s post-hoc test. * p < 0.05; *** p < 0.001 compared with control group; ### p < 0.001, when compared with the group receiving appropriate drug/compound at the same dose without naloxone. Control (), morphine (, 5.0 mg/kg, i.p.), morphine + naloxone (, 5.0 + 5.0 mg/kg, i.p.), DMFP (, 5.0 mg/kg, i.p.) and DMFP + naloxone (, 5.0 + 5.0 mg/kg, i.p.).

